What Is the RSI Indicator? Relative Strength Index Explained
The RSI (Relative Strength Index) measures momentum and identifies overbought or oversold conditions. Learn how it works, how to read it, and how traders apply
Overview
The RSI (Relative Strength Index) measures momentum and identifies overbought or oversold conditions. Learn how it works, how to read it, and how traders apply
Introduction
The Relative Strength Index (RSI) is one of the most widely used technical indicators in trading. Developed by J. Welles Wilder Jr. and introduced in his 1978 book New Concepts in Technical Trading Systems, it remains a cornerstone of momentum analysis more than four decades later.
RSI measures the magnitude of recent price gains against recent losses to determine whether an asset is moving with unusual speed — a signal that conditions may be reaching an extreme.
How RSI Is Calculated
RSI is computed in three steps:
- Calculate the average gain and average loss over the chosen period (typically 14 candles).
- Compute the Relative Strength (RS): RS = Average Gain ÷ Average Loss
- Normalise to a 0–100 scale: RSI = 100 − (100 ÷ (1 + RS))
Most charting platforms calculate RSI automatically, but understanding the formula clarifies why the indicator can move sharply after a single large candle.
"The elements of good trading are: cutting losses, cutting losses, and cutting losses. If you can follow these three rules, you may have a chance."
— Ed Seykota, Commodities Trader & Systems Pioneer Market Wizards (1989)

Reading the RSI Scale
| RSI Value | Interpretation |
|---|---|
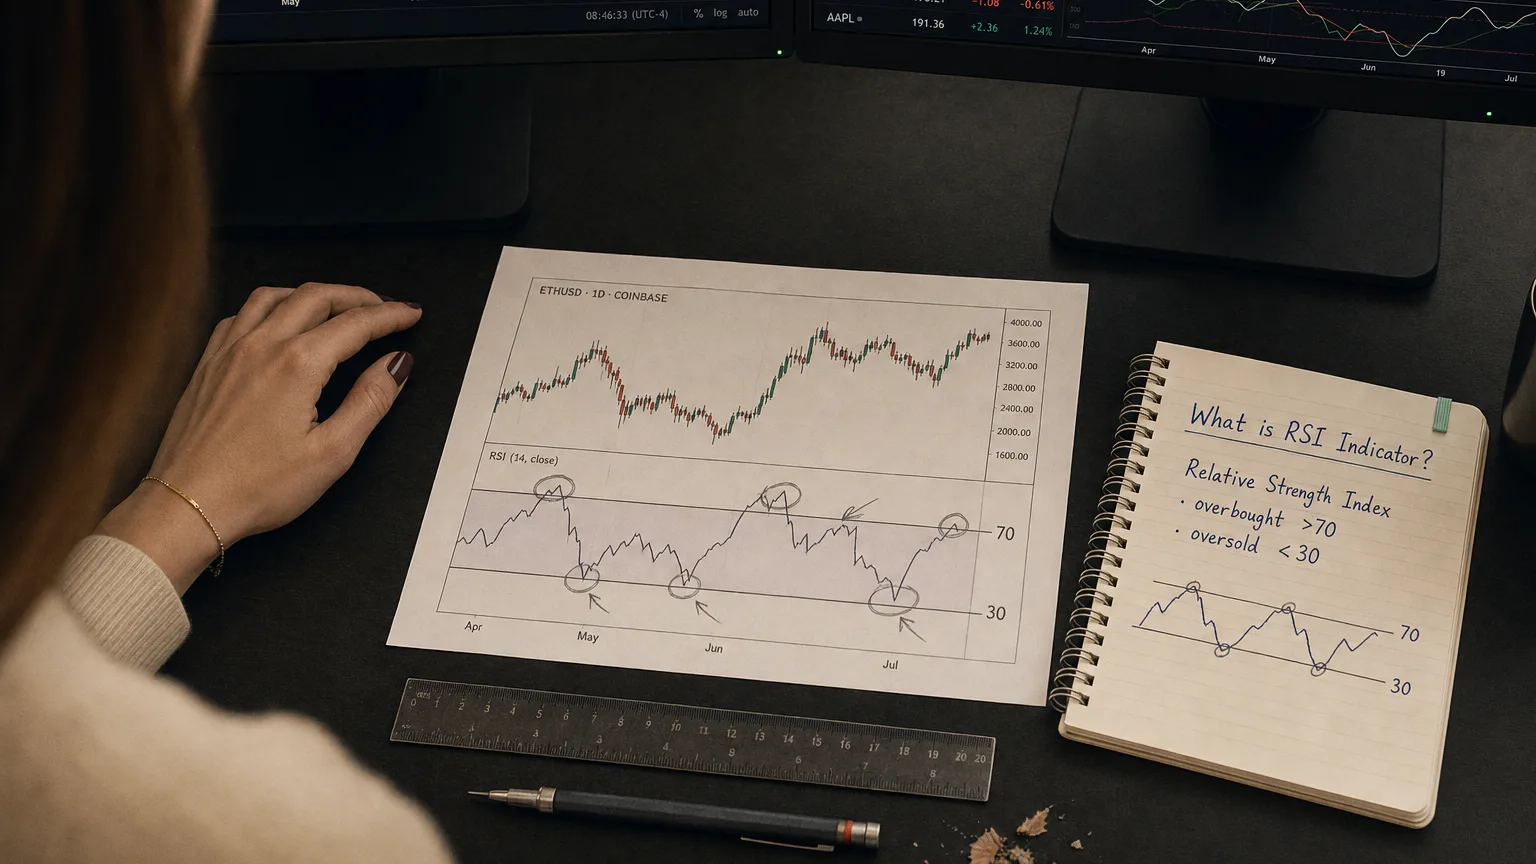
| > 70 | Overbought — price may be extended |
| 50–70 | Bullish momentum |
| 50 | Neutral — roughly equal buying and selling pressure |
| 30–50 | Bearish momentum |
| < 30 | Oversold — selling pressure may be exhausted |
The 50 level acts as a centre-line: sustained readings above 50 confirm uptrends; sustained readings below 50 confirm downtrends.
Three Core RSI Applications
1. Overbought / Oversold Levels
The classic RSI strategy enters long positions when RSI dips below 30 (oversold) and exits or shorts when RSI rises above 70 (overbought). This mean-reversion approach works well in ranging markets but poorly in strongly trending ones.
2. RSI Divergence
Divergence occurs when price and RSI move in opposite directions:
- Bullish divergence: price makes a lower low, RSI makes a higher low → potential reversal up
- Bearish divergence: price makes a higher high, RSI makes a lower high → potential reversal down
Divergence signals are considered higher-quality than simple overbought/oversold thresholds.
3. RSI as Trend Confirmation
In trending markets, adjust the thresholds:
- Uptrend filter: RSI rarely falls below 40; use 40–50 zone as support for long re-entries
- Downtrend filter: RSI rarely rises above 60; use 50–60 zone as resistance for short re-entries
This approach — popularised by Constance Brown — avoids counter-trend trades in trending conditions.

Limitations
- RSI can remain overbought for weeks in strong bull markets (e.g., during parabolic moves)
- Like all lagging indicators, RSI confirms moves rather than predicting them
- False divergences are common; require confluence with price-action signals
Frequently Asked Questions
What is the RSI indicator?
The Relative Strength Index (RSI) is a momentum oscillator that measures the speed and magnitude of recent price changes. It ranges from 0 to 100 and is typically plotted below the price chart to identify overbought or oversold conditions.
What does an RSI above 70 mean?
An RSI reading above 70 is traditionally considered overbought, suggesting the asset may be due for a pullback or consolidation. However, in strong uptrends stocks can remain overbought for extended periods, so RSI above 70 alone is not a sell signal.
What does an RSI below 30 mean?
An RSI below 30 indicates oversold conditions, suggesting that selling pressure may be exhausted and a bounce or reversal could follow. Like overbought signals, oversold readings require confirmation from price action before acting.
What is the standard RSI period setting?
The default and most widely used RSI period is 14, meaning the indicator is calculated using the previous 14 candles (days for daily charts). Shorter periods (e.g., 9) produce more sensitive signals; longer periods (e.g., 21) generate fewer but more reliable signals.