is a financial concept covered in this article. The Half-Hearted Rally That Signals More Downside
The goal of a successful trader is to make the best trades. Money is secondary.

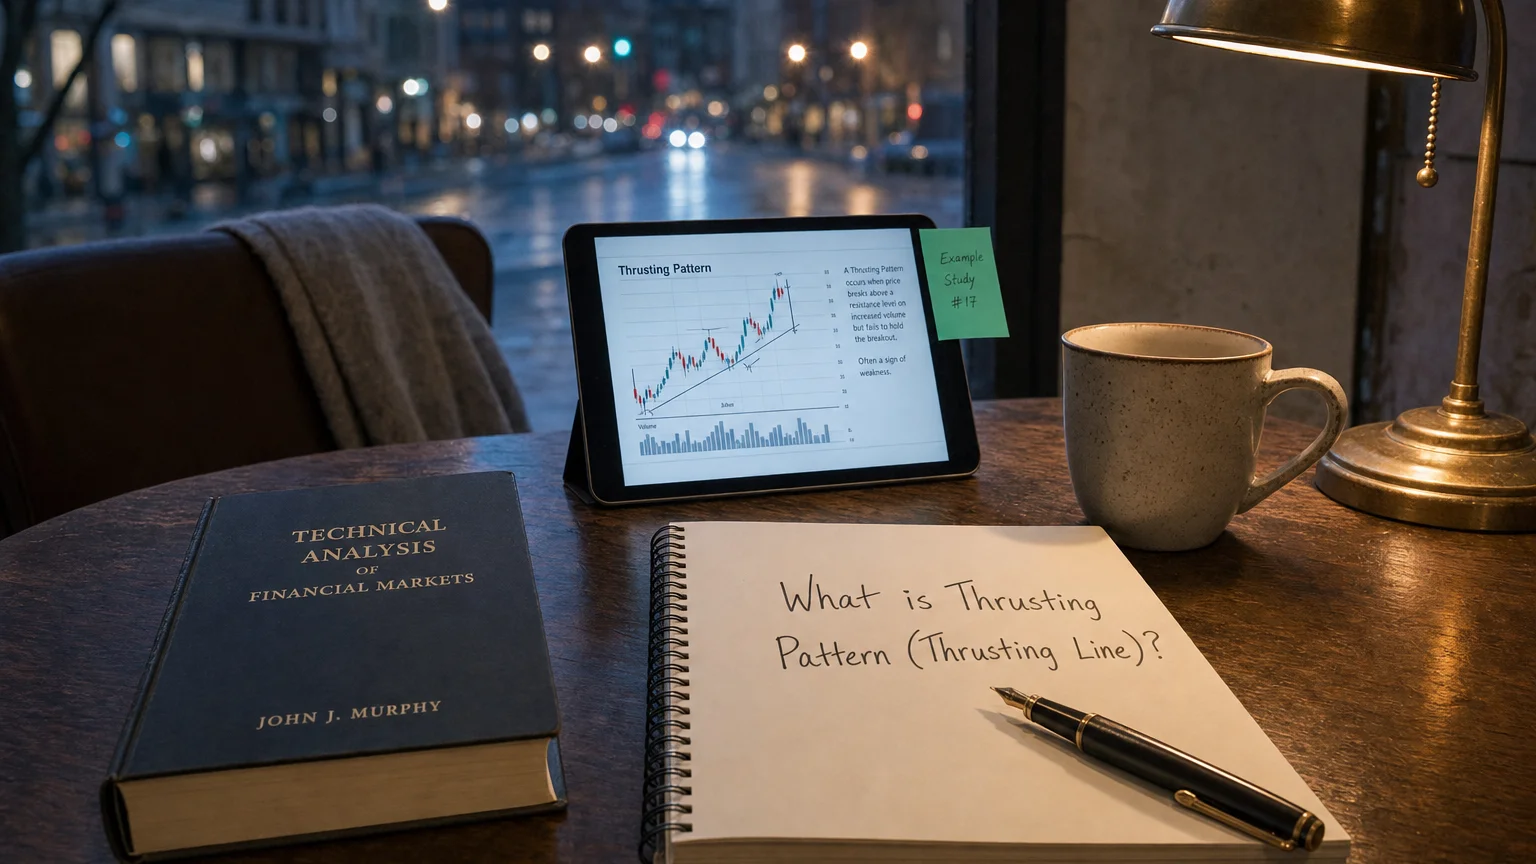
The Thrusting Pattern (sometimes called a Thrusting Line) is a two-candle bearish-continuation formation that appears in an established down-trend. Candle #1 is a long black/red bar that extends the decline; Candle #2 gaps lower at the open, but buyers “thrust” price back up to close inside the prior body yet below its mid-point. The partial gap-fill shows profit-taking rather than genuine accumulation, so textbooks treat the pattern as a pause before the next leg down.
Identification checklist
| Rule | Specification | Why it matters |
|---|---|---|
| Trend | Clear, active decline | Continuation, not reversal |
| Candle #1 | Long bearish body, closes near low | Bears firmly in control |
| Gap | Candle #2 opens below Candle #1 low | Fresh push by sellers |
| Close of Candle #2 | Above Candle #1 close but below its 50 % mark | Bulls can’t reclaim majority of ground |
| Colour of Candle #2 | Usually white/green (but may be small red) | Indicates intraday counter-thrust |
| Gap not filled | If price fully fills the gap intrabar, pattern invalidated | Keeps bearish narrative intact |
Compare with the Piercing Line (close ≥ 50 %) and In-Neck/On-Neck (close at or barely inside prior body).
Market psychology
-
Momentum shove – Candle #1 flushes longs; short sellers confident.
-
Counter-thrust – The gap-down open entices bears again, but dip-buyers manage to push price back into the prior body.
-
Held line – Because bulls can’t reach the body midpoint, the rally is read as weak; if the next bars roll over, late bargain-hunters exit and fuel a fresh slide.
Trading blueprint
| Element | Typical tactic |
|---|---|
| Entry | Conservative – short only after a close below Candle #2 low; Aggressive – short at Candle #2 close when volume is light and RSI < 40. |
| Initial stop | Above Candle #2 high or the gap midpoint (defines 1 R). |
| Targets | 1.5–3 R, nearest demand zone, or measured move = height of Candle #1. |
| Filters that lift edge | Rising volume on Candle #1, falling 20-EMA, pattern forms in upper half of the current swing channel. |
| Time stop | If price hasn’t dropped ≥ 0.5 R within 3–5 bars, tighten or scratch. |
Because the pattern’s range is compact, stops are tight, so even a modest extension can deliver attractive R-multiples.
Statistical tendencies
| Study (Bulkowski, 4.7 M daily U.S. candles) | Result |
|---|---|
| Theoretical bias | Bearish continuation |
| Actual behaviour | Bullish reversal 57 % of the time – essentially random |
| Frequency rank | 74 / 103 (occasional) |
| 10-day performance rank | 5 / 103 – large moves when a breakout occurs |
Interpretation: the thrusting pair is a setup, not a signal; direction hinges on follow-through.
Strengths
-
Clear, objective geometry – easy to code or eyeball.
-
Tight risk anchor at the gap midpoint or Candle #2 high.
-
When confirmation hits, post-breakout moves rank in the top decile for size.
Limitations & pitfalls
-
Edge near coin-flip without confirmation – don’t trade the raw print.
-
Rare if you insist on a true gap that is not filled intrabar.
-
Overnight news can obliterate the gap, voiding the pattern.
Quick visual cheat-sheet
⬇️ Active down-trend
🟥 Long black candle
↘ gap-down open
🟩 Small white candle closes
above prior close but
below mid-body (gap
remains unfilled)
⚑ Short on break below C-2 low
🛑 Stop above gap midpoint
Summary
The Thrusting Pattern is the market’s quick “counter-jab” in a down-trend: a gap lower, a half-hearted rally, and a fresh opportunity for bears—if price promptly rolls over. Trade it with discipline:
-
Wait for confirmation – a decisive close beneath Candle #2 low or the gap floor.
-
Set a surgical stop just above the gap midpoint/high to keep R small.
-
Target 1.5–3 R or the next support shelf, exiting fast if price meanders.
Layer in volume, momentum, and higher-time-frame trend filters to turn this “sash”-shaped pause into a tight-risk continuation trigger rather than a guessing game. Rock on and manage that risk!