is a financial concept covered in this article. The Ultra-Smooth Trend Hugger That Doesn't Overshoot (Much)
The technician believes that anything that can possibly affect the price—fundamentally, politically, psychologically, or otherwise—is actually reflected in the price of that market.
In January 1998, Tim Tillson - a clever software engineer with a knack for trading - published an article in Technical Analysis of Stocks & Commodities called ‘Smoothing Techniques for More Accurate Signals.’ His brainchild? The T3 Moving Average, often just called T3. It’s like taking the already-improved DEMA, giving it another layer of polish, and adding a tunable knob to make it incredibly smooth while still reacting nicely to real trends. Think of it as the luxurious velvet version of moving averages, silky, responsive, and way less jittery.
How T3 Works - The Clever Math Behind the Smoothness
“The technician believes that anything that can possibly affect the price—fundamental, political, psychological, or otherwise—is actually reflected in the price of that market.”
— John J. Murphy, Former Director of Technical Analysis at Merrill Lynch, CMT Association founder Technical Analysis of the Financial Markets: A Comprehensive Guide to Trading Methods and Applications, Prentice Hall / New York Institute of Finance, 1999, Chapter 1 (“The Philosophy of Technical Analysis”), p. 2 (1999)
T3 isn’t just three EMAs slapped together (that’s actually TEMA, a different beast). Tillson built it smarter:
- Start with a regular EMA of price (period n).
- Create a ‘Generalized DEMA’ (GD): GD = EMA * (1 + v) - EMA(of EMA) * v, where v is the volume factor (0 to 1).
- Apply GD again to the result, then once more, triple layering for extra smoothness.
When v = 0, T3 behaves like an EMA of EMA of EMA (super smooth but laggy). When v = 1, it’s more like a triple DEMA (faster but can overshoot). Most traders stick around v = 0.7 for the sweet spot, smooth like butter, responsive like a sports car.
Popular default: period 8-20, v=0.7. It needs more historical data to start (similar to DEMA, but a bit more).
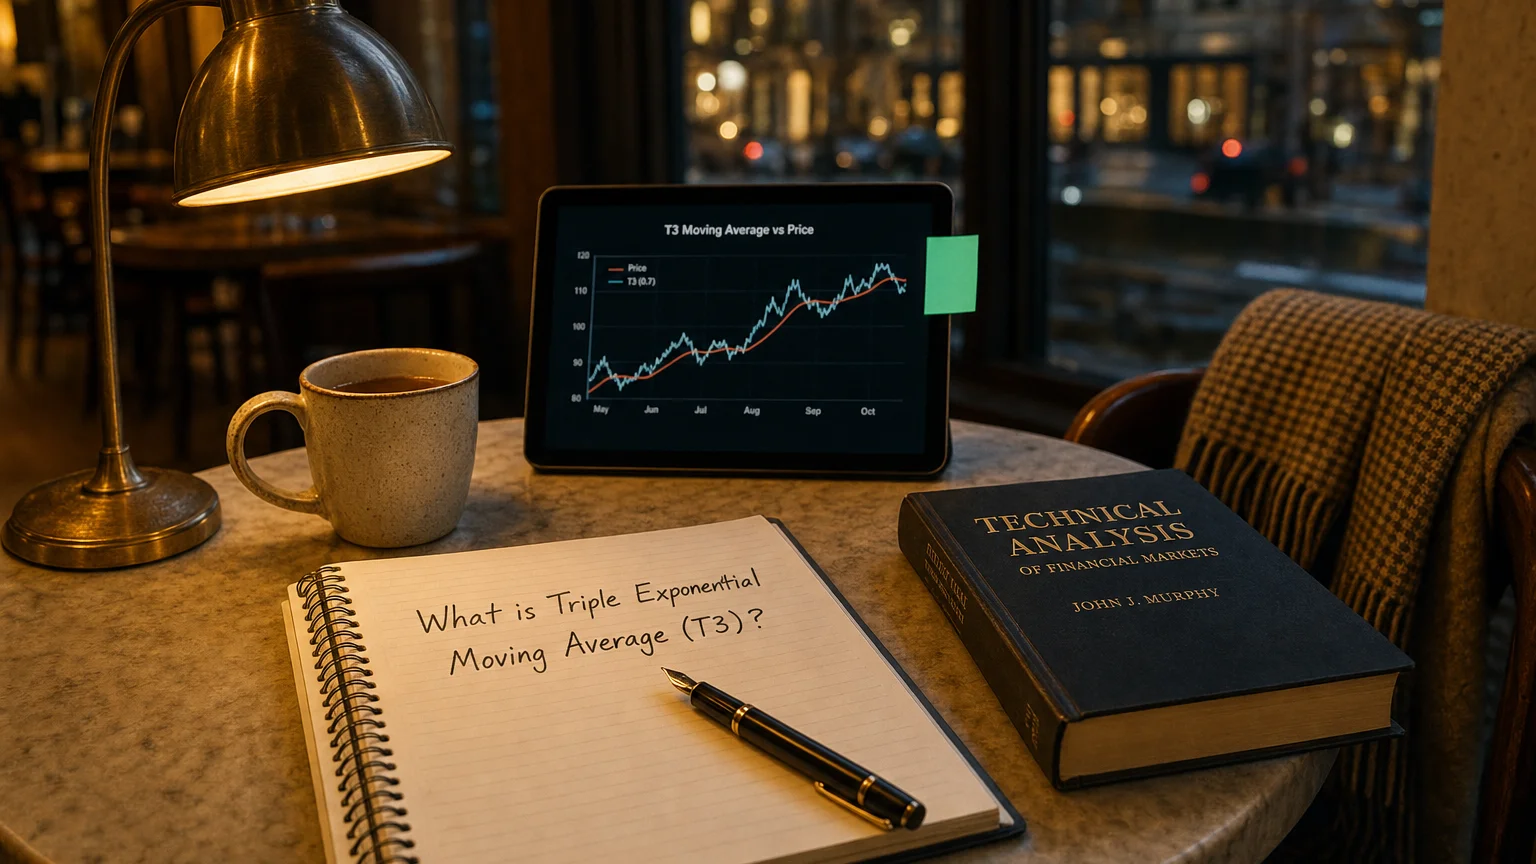
Here’s a typical T3 in action on a stock chart:
And another example showing how it hugs trends:
Why T3 Stands Out - The Magic Properties
T3 earns its cult following because it nails the tricky balance:
- Ultra-smooth: Filters out noise better than most, price barely touches it during strong trends.
- Low lag: Reacts quicker than a same-period EMA, without the wild swings of shorter averages.
- Adaptive-ish: The v-factor lets you dial in more responsiveness when markets get exciting.
- Less overshooting: Unlike pure TEMA, T3 curves gracefully around turns instead of shooting past price.
Result? A beautiful, flowing line that’s a joy to trade off, especially in trending markets.
Classic T3 look on a chart:
Choosing Your Settings - Periods and That Mysterious v-Factor
Two knobs to twist:
- Period (n): Short (8-14) for nimble scalping/swing; medium (20-30) for general trending; long (50+) for big-picture support.
- Volume factor (v): 0.618 (golden ratio vibe) to 0.8, higher v = more responsive (but risk of slight overshoot); lower = smoother but a tad more lag.
Pro tip: Start with n=14, v=0.7. Tweak based on the asset, crypto loves higher v, sleepy stocks prefer lower.
Practical Trading Plays - Rules That Actually Work
T3 shines in these setups:
- Trend filter: Long only when price > T3 and it’s sloping up; short when below and sloping down.
- Pullback entries: In an uptrend, buy dips to the T3 line (it often acts as dynamic support).
- Dual T3 crossover: Fast T3(10, 0.7) crossing slow T3(30, 0.7) = strong buy/sell signal.
- Trailing stops: Park your stop just below the T3 line (add a buffer with ATR), lets winners run smoothly.
Always confirm with higher timeframe or another indicator, T3 hates choppy ranges!
Another clean T3 example:
Strengths, Weaknesses, and the Occasional Oops
The Awesome Side
- One of the smoothest MAs out there, fewer fakeouts in trends.
- Great balance of speed and calm; outperforms plain EMA or even DEMA in many tests.
- Widely available on platforms (TradingView, MT4/5, Thinkorswim, etc.).
The Not-So-Awesome Side
- Can still overshoot a bit on sharp reversals (though less than TEMA).
- Struggles in tight sideways markets, too many whipsaws if you’re aggressive.
- A smidge more complex to understand and optimize than basic EMAs.
Your T3 Launch Checklist
- Pick your style: aggressive scalps (short n, higher v) vs chill trends (longer n, lower v).
- Align with the big-picture trend on higher timeframes.
- Define risk first, stops beyond structure or T3 ± ATR multiple.
- Backtest ruthlessly on your favorite assets, find your personal v-magic.