The Average Price Indicator calculates (High + Low + Close) divided by 3, producing a single balanced value per period—also called Typical Price—that reflects intraday equilibrium and serves as the foundation for VWAP, Money Flow Index, and Chaikin indicators.
The goal of a successful trader is to make the best trades. Money is secondary.

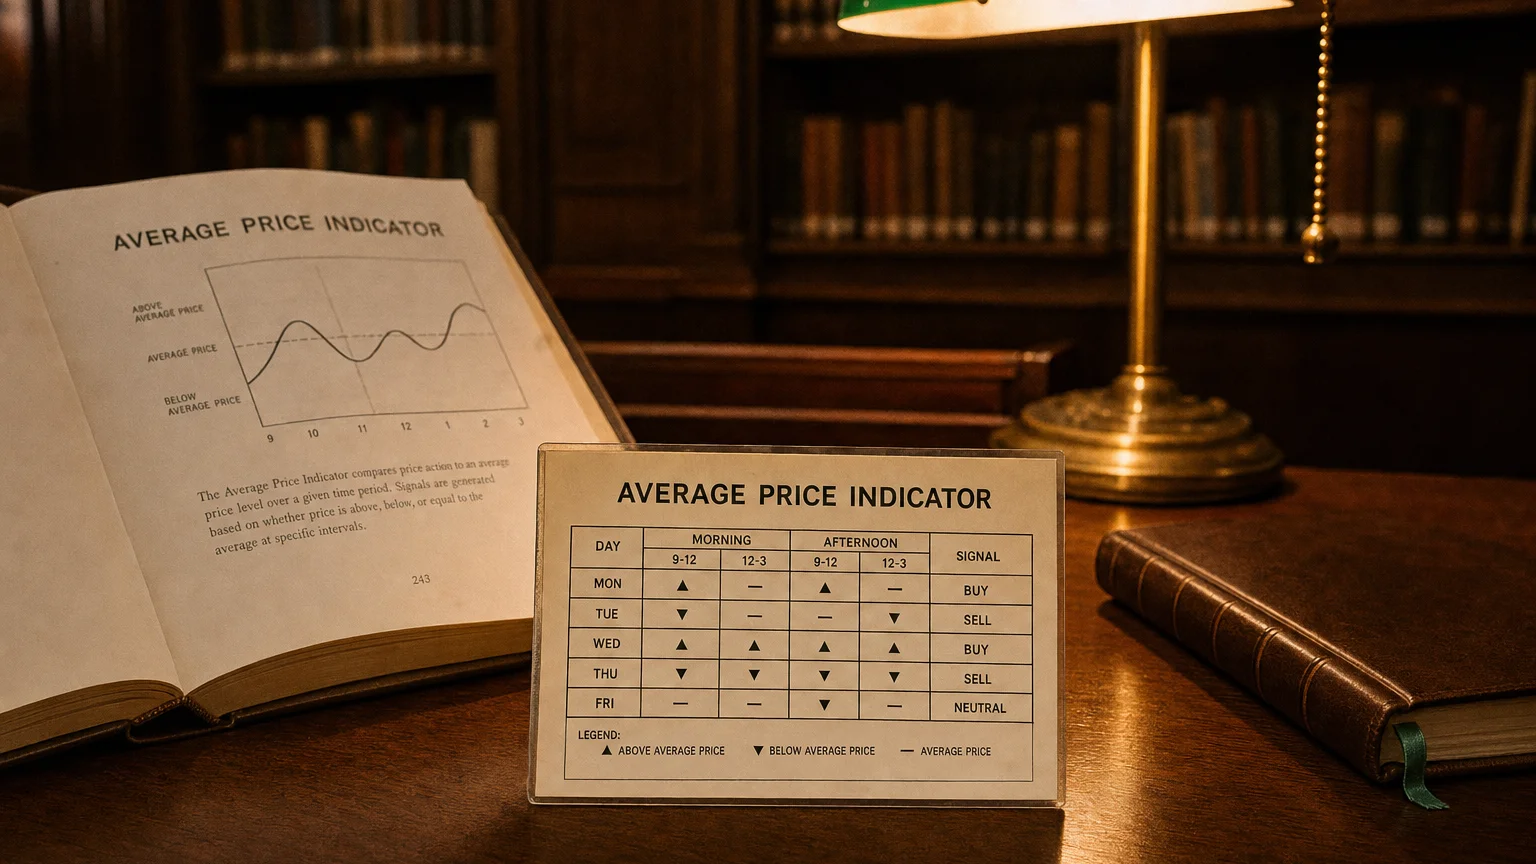
The Average Price Indicator, also known as the Typical Price, is a simple yet insightful tool used in technical analysis to represent the central value of a price range for a given period. It helps smooth out market noise and provides a clearer picture of price equilibrium, often serving as a base for other indicators and trading strategies.
Formula
(Formula — visualization pending)
This single number provides a balanced average of the most important intraday price points.
Interpretation
-
The Average Price acts as a reference point for market behavior.
-
A price trading above the average may indicate bullish sentiment.
-
A price trading below the average may indicate bearish sentiment.
-
It is often used to detect mean reversion opportunities or short-term equilibrium zones.
Use Cases and Strategic Value
-
Volume-Weighted Indicators:
- Often used as the input for Volume Weighted Average Price (VWAP), Money Flow Index (MFI), and Chaikin indicators.
-
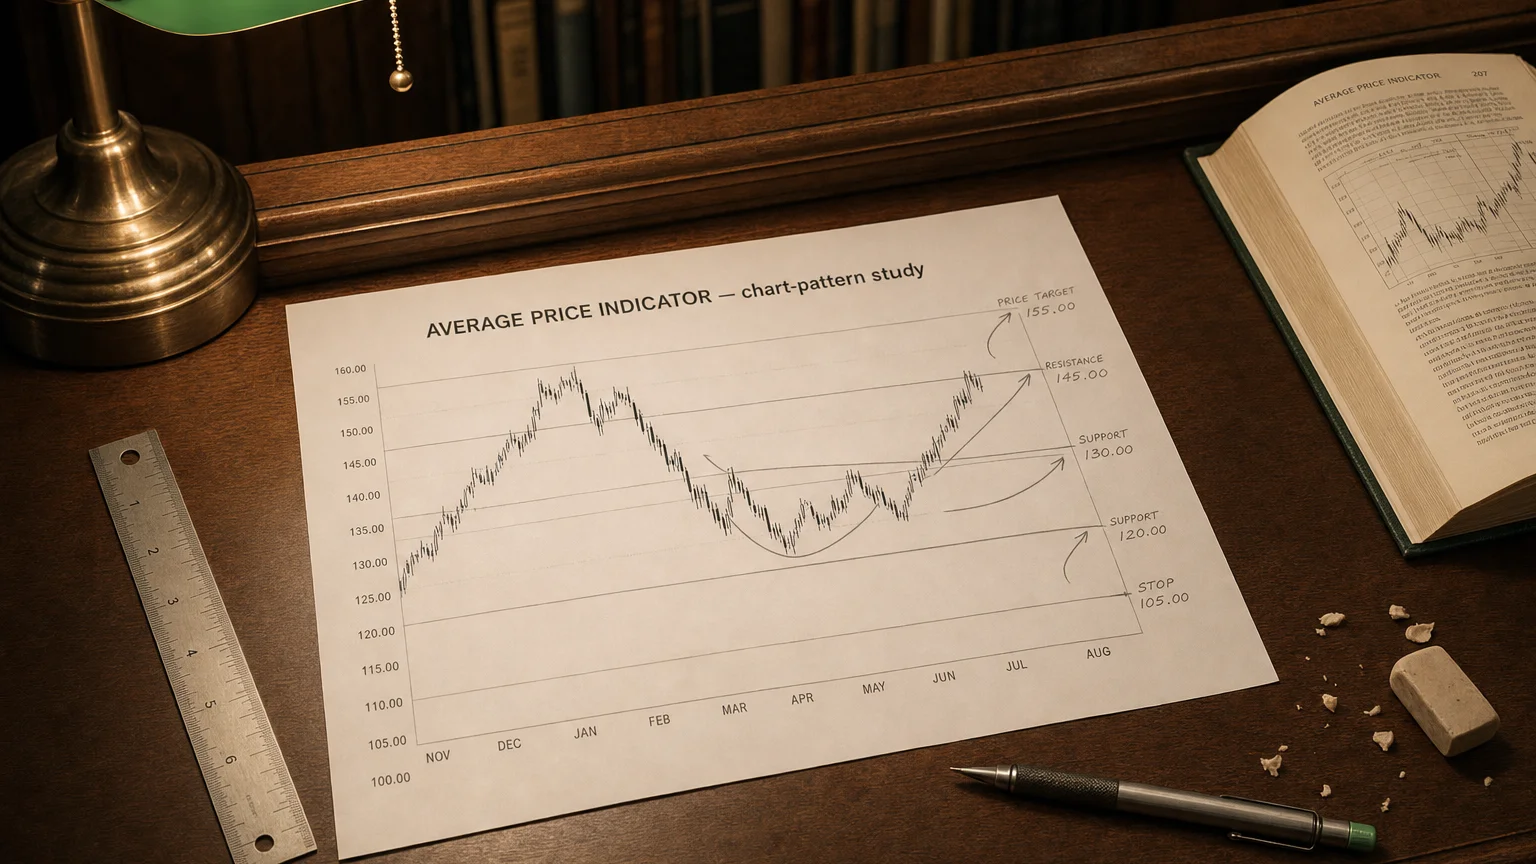
Support/Resistance Context:
- Can act as a soft pivot point for short-term support and resistance evaluation.
-
Confirmation Tool:
- Helps confirm signals from other indicators (e.g., RSI, MACD) by showing whether price is extended or reverting to its center.
-
Institutional Tools:
- In institutional trading, the average price is used to benchmark execution performance versus daily VWAP or other intra-session references.
Professional Applications
-
Quantitative Trading Models: Used as a neutral baseline for entry calibration and risk targeting.
-
Algorithmic Execution Engines: Helps algorithms decide whether current execution is occurring at a fair average or at extremes.
-
Intraday Charting: Widely applied in intraday analytics to spot inefficiencies and price stabilization zones.
Limitations
-
Lagging nature: It’s a backward-looking average, so not suitable for anticipating sharp moves.
-
No directional bias: Must be paired with trend or momentum indicators for actionable signals.
-
Not dynamic: It lacks volatility adjustments unless embedded into broader frameworks (e.g., VWAP bands, Bollinger overlays).
Summary for Analysts and Traders
The Average Price Indicator is a fundamental, low-latency measure of intraperiod price balance, offering clear insight into where the market has been gravitating. While simple, it’s a powerful building block in quantitative models, institutional trading tools, and real-time strategy filters. When used in context—especially with volume, volatility, and trend indicators—it becomes a strategic point of reference for timing, confirmation, and performance benchmarking.
Q · 01How is the Average Price Indicator calculated?+
Q · 02What is the Average Price Indicator used for?+
Q · 03What is the difference between Average Price and closing price?+
Q · 04Does the Average Price Indicator show trend direction?+