MidPoint Over Period Indicator is a financial concept covered in this article. The Rolling Centerline That Reveals Range Equilibrium
There is nothing new on Wall Street or in stock speculation. What has happened in the past will happen again and again.

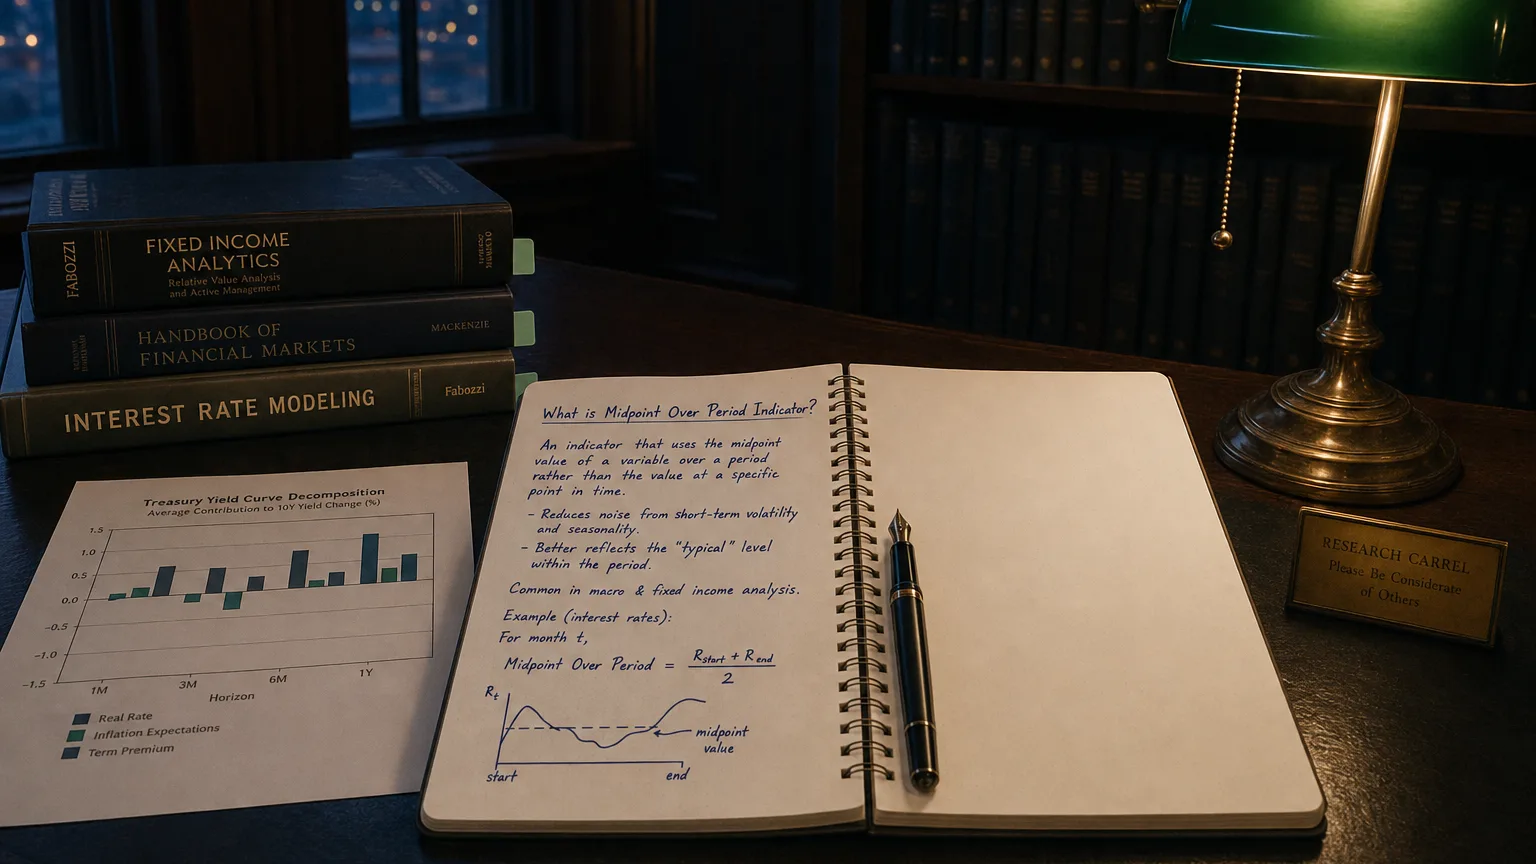
The MidPoint over N bars plots the exact halfway mark between the highest High and the lowest Low seen in a rolling look-back window.
-
Output: one value per bar — the “fair-middle” of the recent price range.
-
Core use: gauge where the center of gravity of recent action sits, then judge whether price is trading above (bullish bias) or below (bearish bias) that balance line.
Formula (Couldn’t Be Simpler)
(Formula — visualization pending)
Where:
-
HHH = High price
-
LLL = Low price
-
NNN = look-back length (default 14 in many libraries)
No smoothing, no weighting — just the mid-range anchor.
Interpreting the Line
| Price vs. MidPoint | Market Read | Tactics |
|---|---|---|
| Price > MidPoint & rising | Buyers dominating top half of range | Favor longs; pullbacks to MidPoint act as dynamic support |
| Price < MidPoint & falling | Sellers controlling lower half | Favor shorts; MidPoint becomes resistance |
| Price oscillates around MidPoint | Balanced, ranging market | Mean-reversion plays: fade edges, target MidPoint |
| MidPoint climbing | Range itself drifting upward | Confirms underlying up-bias even in swings |
| MidPoint flat | Stable range ceiling/floor | Wait for breakout before committing |
Popular Applications
| Use-Case | How MIDPOINT Helps |
|---|---|
| Range Trading | Define the “median magnet”; enter fades at band extremes, exit near MidPoint |
| Dynamic Support/Resistance | Acts like a rolling pivot line inside Donchian channels |
| Trend Filter | Only take signals when price stays on one side of rising/falling MidPoint |
| Oscillator Centerline | Feed MidPoint into indicators (e.g., RSI of MidPoint) for noise-reduced swings |
Parameter Tweaks
| Length N | Feel & Lag | When To Use |
|---|---|---|
| 5–10 bars | Twitchy; follows quick swings | Scalping, intraday micro ranges |
| 14–30 bars | Balance of speed and stability | Swing trading equities/FX |
| 50–100+ bars | Very smooth; shows macro balance | Position trades, weekly charts |
Pro tip: Align N with your cycle of interest (e.g., 20 bars ≈ one trading month).
Strategy Playbook
- MidPoint Bounce
-
Identify sideways market with flat MidPoint.
-
Buy near LowerBand (LLV), target MidPoint; sell near UpperBand (HHV), target MidPoint.
-
Use tight stops beyond range edge.
- Break & Retest
-
When price closes above UpperBand, wait for pullback to former MidPoint.
-
If bounce occurs above that line, join new trend with MidPoint as trailing stop reference.
- Trend Confirmation Path
-
Overlay 20-EMA.
-
Go long only if price and MidPoint both above EMA and MidPoint is rising ≥ slope threshold.
-
Reverse logic for shorts.
Strengths & Limitations
| Strengths | Limitations |
|---|---|
| Zero-lag on defining range center | Gives no directional bias without context |
| Incredibly easy to compute & visualize | Sensitive to outlier spikes within window |
| Works on any data series (price, indicator, volume) | Flat-line during strong trends; better as support/resistance than signal |
| Excellent complement to Donchian or ATR bands | Needs combo with momentum filter for breakout trades |
Implementation Checklist
-
Set look-back to match trading horizon.
-
Plot MidPoint with Donchian channels or ATR bands for context.
-
Back-test bounce & breakout rules on target asset.
-
Layer filters — trend MA, volume surge, or oscillator confirmation.
-
Automate alerts: price cross MidPoint, MidPoint slope flip, range width expansion.
-
Review every quarter — widen N in high-volatility regimes, shorten when markets dull.
Bottom Line
The MidPoint over period is your chart’s equilibrium line — a no-nonsense marker of the range’s center. Use it:
-
As a mean-reversion magnet inside consolidations,
-
A dynamic pivot for breakout retests, and
-
A bias filter that tells you which half of the field buyers or sellers control.
Find the middle, trade the edges, and keep your strategy balanced. Rock on!