
Highest High Over X Period (HHV) is a financial concept covered in this article. The Dynamic Ceiling Tracker That Buzzes on Fresh Breakouts
There is nothing new on Wall Street or in stock speculation. What has happened in the past will happen again and again.

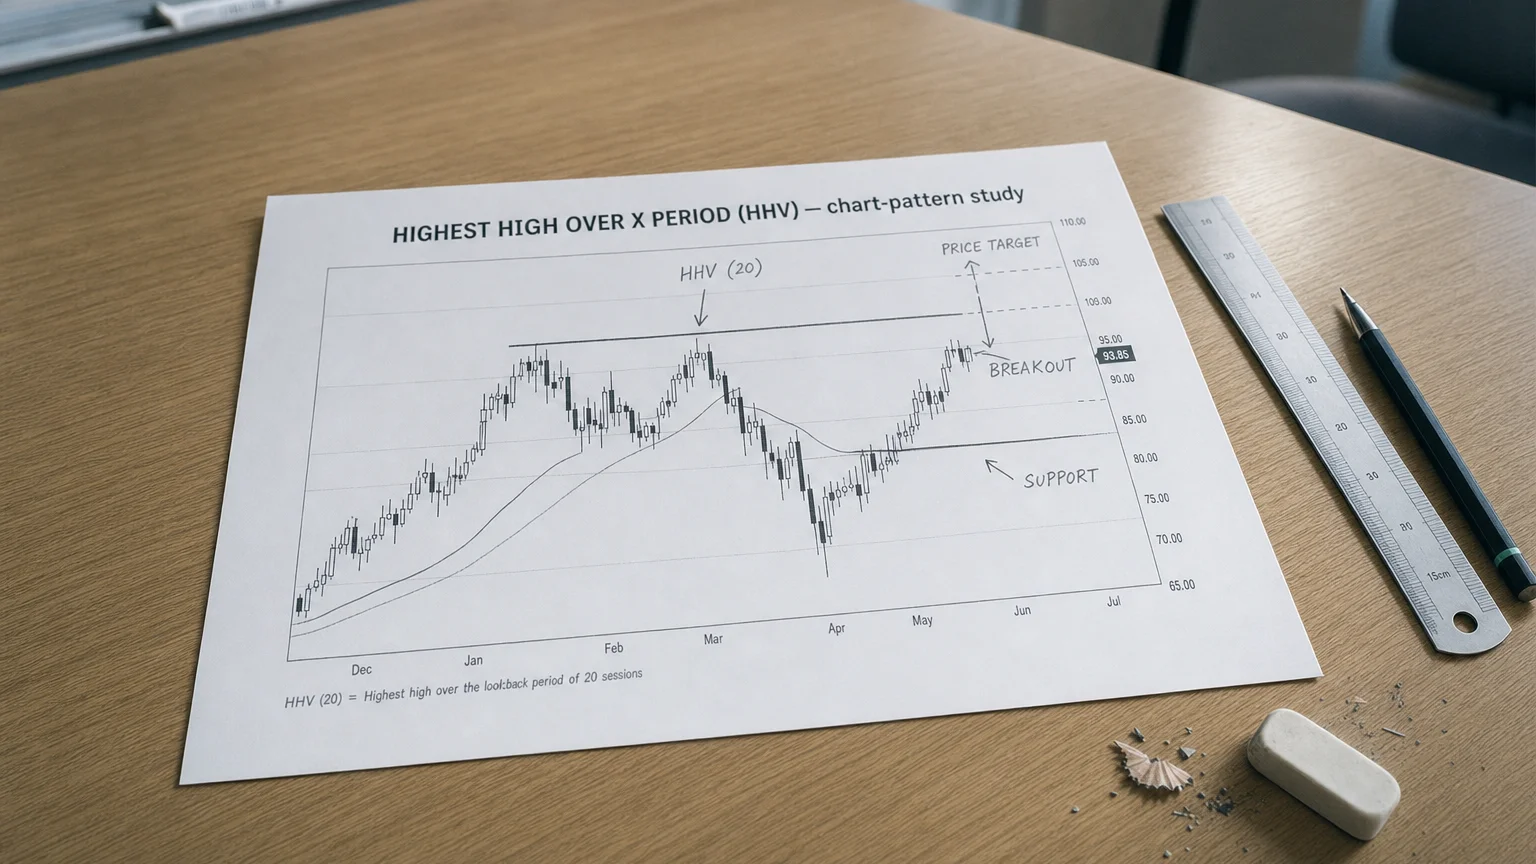
The Highest-High-Value (HHV) indicator returns the maximum price reached within a rolling look-back window of N bars.
-
On a daily chart with N = 20, HHV plots the highest price seen in the last 20 trading days—updated every new bar.
-
Works on high, close, indicator values (e.g., RSI peaks) … basically anything numerical.
Think of HHV as the market’s “recent ceiling”: a dynamic resistance reference that marches forward with time.
Simple Calculation
At each new bar t:
(Formula — visualization pending)
Where P is the chosen price (often the High).
No smoothing, no alpha tuning—just pure max logic.
Reading & Using the Line
| HHV Behavior | Market Meaning | Typical Plays |
|---|---|---|
| Price breaks above HHV | Fresh N-bar high → bullish breakout | Enter long; place stop just under former HHV |
| HHV flat | Range-bound ceiling | Fade moves near HHV or wait for breakout |
| HHV stair-steps up | Higher-high sequence → up-trend confirmed | Trail stop a few ticks below HHV minus buffer |
| HHV slopes down | Lower ceiling (if using Close or indicator highs) | Potential down-trend intensification |
Common Applications
| Setup | How HHV Fits |
|---|---|
| Donchian Channels (Top Band) | HHV(N) of High for breakout entries |
| Range Break Scans | Screen symbols hitting 52-week (252-day) HHV highs |
| Trailing Stop | Protect profit by ratcheting stop to HHV(N)k behind price |
| Trend Confirmation | Require price > HHV(50) before taking long pullbacks |
Parameter Tweaks
| N Length | Market Feel | Best For |
|---|---|---|
| Short (5–10) | Very sensitive; lots of break signals | Scalping, high-beta stocks |
| Medium (20–55) | Balance whip vs. lag | Swing trading, FX majors |
| Long (100–252) | Big-picture highs | Position trades, 52-wk breakout scans |
Pro tip: match N to the cycle you trade (e.g., 20 bars ≈ one trading month).
Strategy Playbook
- Donchian Breakout
-
Define UpperBand = HHV(20), LowerBand = Lowest Low (LLV)(20).
-
Long when close > UpperBand; short when close < LowerBand.
-
Exit on opposite band touch or ATR-based stop.
- HHV-Pullback Trend
-
Trend filter: price > HHV(50).
-
Wait for a pullback to 20-EMA.
-
Enter on bullish candle; stop under last swing low.
- 52-Week High Momentum
-
Scan weekly charts for close within 1% of HHV(252).
-
Rank by volume surge or relative strength.
-
Position build on confirmed breakout weeks.
Strengths & Limitations
| Strengths | Limitations |
|---|---|
| Zero lag on identifying actual highs | No smoothing → can whipsaw around false spikes |
| Ultra-simple, fast to compute | Gives no info about lows or mid-range |
| Universally understood (52-wk high = headline) | Works poorly alone in choppy, mean-reverting markets |
| Integral to proven systems (Turtle, Donchian) | Purely price-based—needs volatility or volume context |
Implementation Checklist
-
Define time horizon (intraday vs. multi-month).
-
Pick N aligned with that horizon.
-
Back-test breakouts vs. ATR filters to curb fake moves.
-
Combine with trend or volatility filter (e.g., rising 200-SMA, increasing volume).
-
Automate scans/alerts for price ≥ HHV(N) to jump on fresh highs instantly.
-
Re-evaluate quarterly—if whipsaws spike, lengthen N; if late, shorten.
Bottom Line
The Highest-High-Value indicator is the market’s altimeter: it tells you exactly how high price has climbed within your chosen window. Whether you’re running classic Donchian breakouts, setting trailing stops, or hunting all-time highs for momentum plays, HHV keeps your trading radar locked on the true ceiling—no guesswork.
Dial in your N, watch the roof, and blast through when the crowd joins the riff. Rock on!
Q · 01What is Highest High Over X Period Hhv Breakout Buzzer Beater?+