is a financial concept covered in this article. The Time-Stamp That Reveals How Fresh Your Peak Really Is
The goal of a successful trader is to make the best trades. Money is secondary.

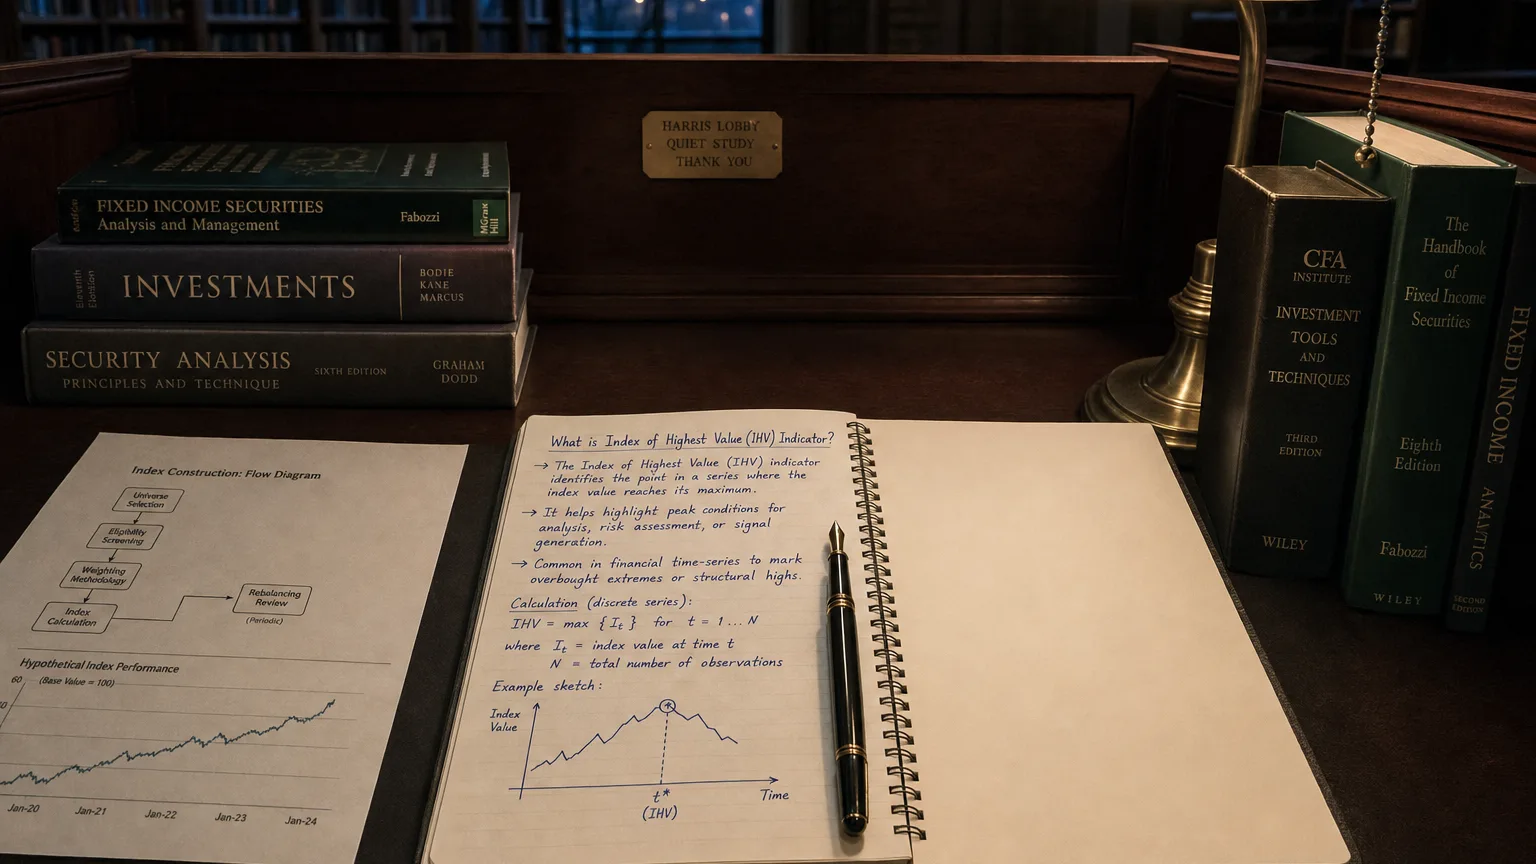
Most traders track how high price has climbed (e.g., Highest-High Value), but equally useful is knowing when that high occurred.
The Index of Highest Value (IHV) does exactly that:
-
Output: an integer 0…N-1
-
Meaning: “The most recent peak within the last N bars happened X bars ago.”
-
Interpretation:
-
0 = today’s bar just set a new N-bar high.
-
5 = the high was five bars back.
-
N-1 = the window’s very first bar still holds the record, so the high is about to roll off.
-
Formula (Simple but Powerful)
For each bar t with look-back length N:
(Formula — visualization pending)
Where P is the series you’re analysing (commonly High, but can be Close, Volume, RSI peaks, etc.).
Practical Readings & Their Messages
| IHV Value | What It Tells You | Typical Action |
|---|---|---|
| 0 | A brand-new high this bar | Momentum hot — breakout entry / add to winners |
| 1–3 | Peak is very recent | Trend healthy; stay with position |
| 4–(N/2) | Peak aging but current | Monitor for pullback; partial profits okay |
| > N/2 | High is stale | Momentum fading; tighten stops or hedge |
| N-1 | Oldest bar still the high | Window will reset next bar; breakout trigger re-arms |
Popular Applications
| Use-Case | How IHV Helps |
|---|---|
| Donchian / Turtle Breakouts | Trade only when IHV = 0 (fresh 20-bar high) to avoid stale breakouts. |
| Time-Based Trailing Stops | Exit long if IHV > 10 (no new high in 10 bars) — trend losing steam. |
| Mean-Reversion Filters | Fade rallies only when IHV is large (peak is “old”), signalling exhaustion. |
| Indicator Timing | Apply IHV to RSI or ATR values to gauge how long since last momentum/volatility spike. |
Parameter Guidelines
| Look-Back N | Market Rhythm Captured | Typical Instruments |
|---|---|---|
| 5–10 bars | Micro swings | 1-min / 5-min scalps |
| 20–50 bars | Monthly trading cycle | Daily swing trades |
| 100–252 bars | 52-week horizon | Weekly position trades |
Rule of thumb: choose N to match the cycle you care about (e.g., 20 trading days ≈ 1 month).
Strategy Templates
- A. Fresh-High Momentum
-
Define HHV(N) and IHV(N).
-
Go long when Close > HHV AND IHV = 0.
-
Trail stop under most recent swing low; exit if IHV ≥ M (e.g., 12).
- B. Pullback Validation
- Stay in an up-trend if IHV ≤ 5 (high made within last week) even during dips—momentum still alive.
- C. Volatility Expansion Setup
-
Compute IHV on ATR.
-
When IHV(ATR) rises toward N, volatility is contracting; expect breakout when it flips to 0.
Strengths & Caveats
| Advantages | Watch-Outs |
|---|---|
| Zero-lag age information — instantly shows freshness of a peak | Flips quickly on spiky data; combine with filters |
| Works on any numeric series (price, volume, indicators) | Purely descriptive — needs companion rules for entries/exits |
| Great for exit timing and breakout confirmation | May oscillate in tight ranges; tune N appropriately |
Implementation Checklist
-
Pick the series to analyse (High, Close, custom metric).
-
Set an N aligned with your timeframe goal.
-
Back-test age thresholds for exits / filters.
-
Combine with HHV/LLV, volatility, or volume cues for robust rules.
-
Automate alerts — e.g., notify when IHV resets to 0 or exceeds a “stale” level.
-
Review quarterly — widen or narrow N if market volatility regimes change.
Bottom Line
The Index of Highest Value adds the time dimension to price extremes. By telling you how old the last peak is, it sharpens breakout trades, refines trailing stops, and filters false momentum. Keep an eye on that age meter and you’ll know whether the market’s high note is still ringing—or fading fast.Stay in sync, spot the fresh highs, and keep your trading riffs tight!
Q · 01What is Index Of Highest Value Ihv Indicator Time Stamping The Peak?+