
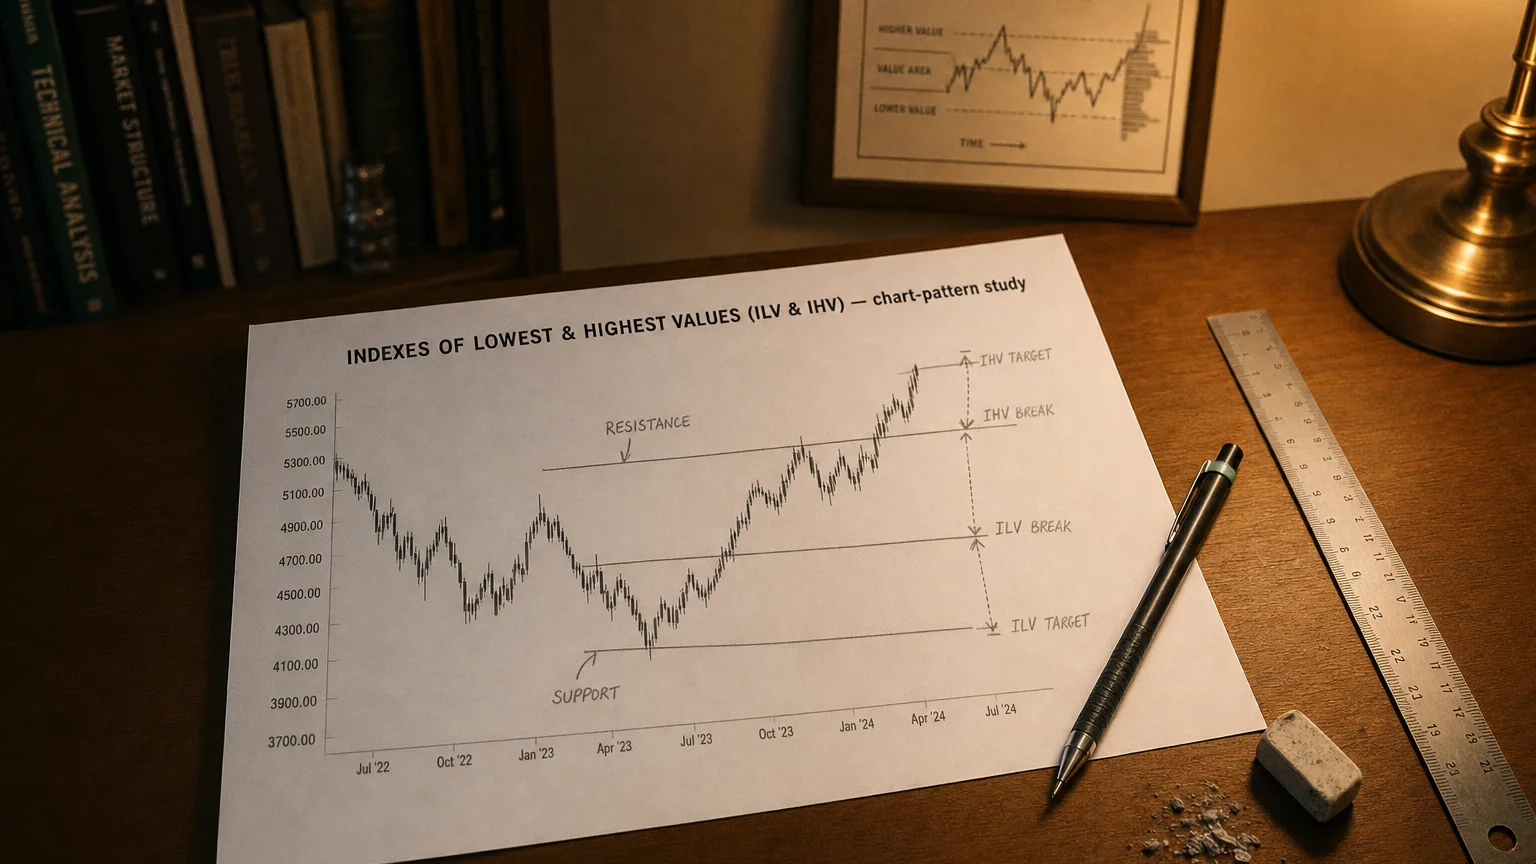
Indexes of Lowest & Highest Values (ILV & IHV) is a financial concept covered in this article. The Time-Stamp Duo That Ages Your Market Peaks and Troughs
There is nothing new on Wall Street or in stock speculation. What has happened in the past will happen again and again.

What These Indexes Tell You
-
IHV (N): “How many bars ago did the highest high of the last N bars occur?”
-
ILV (N): “How many bars ago did the lowest low of the last N bars occur?”
Both return an integer from 0 to N − 1 every bar:
| Reading | Meaning |
|---|---|
| 0 | Today just set a fresh extreme. |
| 5 | The extreme happened 5 bars back. |
| N − 1 | The extreme is old (first bar of window) and may roll off next bar. |
Key benefit: adds the time component to simple HHV/LLV levels, letting you gauge the freshness vs. staleness of recent peaks and troughs.
One-Line Formulas
(Formula — visualization pending)
Where
-
HHH = High price series, LLL = Low price series
-
NNN = look-back window (e.g., 20 bars)
-
Result is 0 (current bar) … N − 1 (oldest in window).
No smoothing, weighting, or lag — pure index lookup.
Practical Interpretation
| Scenario | IHV | ILV | Message | Typical Action |
|---|---|---|---|---|
| Fresh upside breakout | 0 | > some value | Bulls just printed a new N-bar high | Consider long entry / add to winners |
| Prolonged down-trend | > N/2 | ≤ 3 | Lows keep refreshing, highs are stale | Stay short; avoid early bottom-picking |
| Aging range floor | > N/2 | N − 1 | Low is about to roll off window | If no new low forms, support may lift; prep for bounce |
| Diverging extremes | 0 | 0 | Simultaneous new high & low (large range bar) | Expect volatility; wait for follow-through |
Core Use-Cases
| Use-Case | How ILV & IHV Add Edge |
|---|---|
| Breakout Filters | Enter only when price breaks HHV/LLV and the corresponding index = 0 (confirms freshness). |
| Time-Based Trailing Stops | Exit a long if ILV < threshold or IHV hasn’t reset for X bars (trend stalling). |
| Mean-Reversion Entries | Fade highs if IHV is large (peak is old); fade lows if ILV is large (trough is old). |
| Volatility Compression Signals | Apply indexes to ATR or Volume to spot “old” extremes → upcoming expansion. |
Parameter Guidance
| N Length | Captures | Suitable For |
|---|---|---|
| 5 – 10 bars | Micro swings | Scalping, 1-min / 5-min |
| 20 – 55 bars | Monthly trading cycles | Daily swing trades |
| 100 – 252 bars | Annual extremes | Weekly position trades, 52-week scans |
Rule of thumb: align NNN with the market rhythm you actually trade.
Strategy Templates
- A │ Turtle-Style Breakout with Time Filter
-
HHV (20) & IHV (20) on highs.
-
Long only if close > HHV and IHV = 0.
-
Exit if ILV(10) = 0 (new 10-bar low) or IHV > 10 (no new high for 10 bars).
- B │ Aging-Low Reversion
-
In a down-move, ILV > 15 (with N=20N=20N=20) signals the low is getting stale.
-
Pair with bullish RSI divergence; target mean back to 20-EMA.
- C │ Volatility-Squeeze Breakout
-
Compute IHV/ILV on ATR(14).
-
If both indexes > N − 3 (old extremes in ATR), volatility contracted → prep for range break in price.
Strengths & Limitations
| Strengths | Limitations |
|---|---|
| Zero-lag age info for peaks & troughs | Sensitive to one-bar spikes (filter with ATR/volume) |
| Enhances exits & breakout freshness | Descriptive only — needs other signals for entries |
| Works on any series (price, volume, indicators) | Quick flips in noisy data; tune N to cut churn |
Implementation Checklist
-
Select series (High/Low, indicator, volume).
-
Choose N aligned with timeframe.
-
Test thresholds (e.g., exit if index > 10).
-
Combine with HHV/LLV bands, momentum, or volume filters.
-
Automate alerts for index reset (0) and “stale” crossings.
-
Review quarterly — adjust N if volatility regime shifts.
Bottom Line
The Indexes of Lowest & Highest Values transform static support/resistance into a stopwatch — revealing how fresh or how stale the market’s extremes really are. Layered onto breakout, trend-following, or mean-reversion systems, they sharpen timing, tighten risk, and keep you trading the current edge instead of yesterday’s news.
Watch the time-stamps on those peaks and troughs, and keep your trades rock-solid.
Q · 01What is Indexes of Lowest & Highest Values?+