Lowest & Highest Values over N Bars is a financial concept covered in this article. The Donchian-Style Envelope That Maps Dynamic Range and Breakouts
There is nothing new on Wall Street or in stock speculation. What has happened in the past will happen again and again.

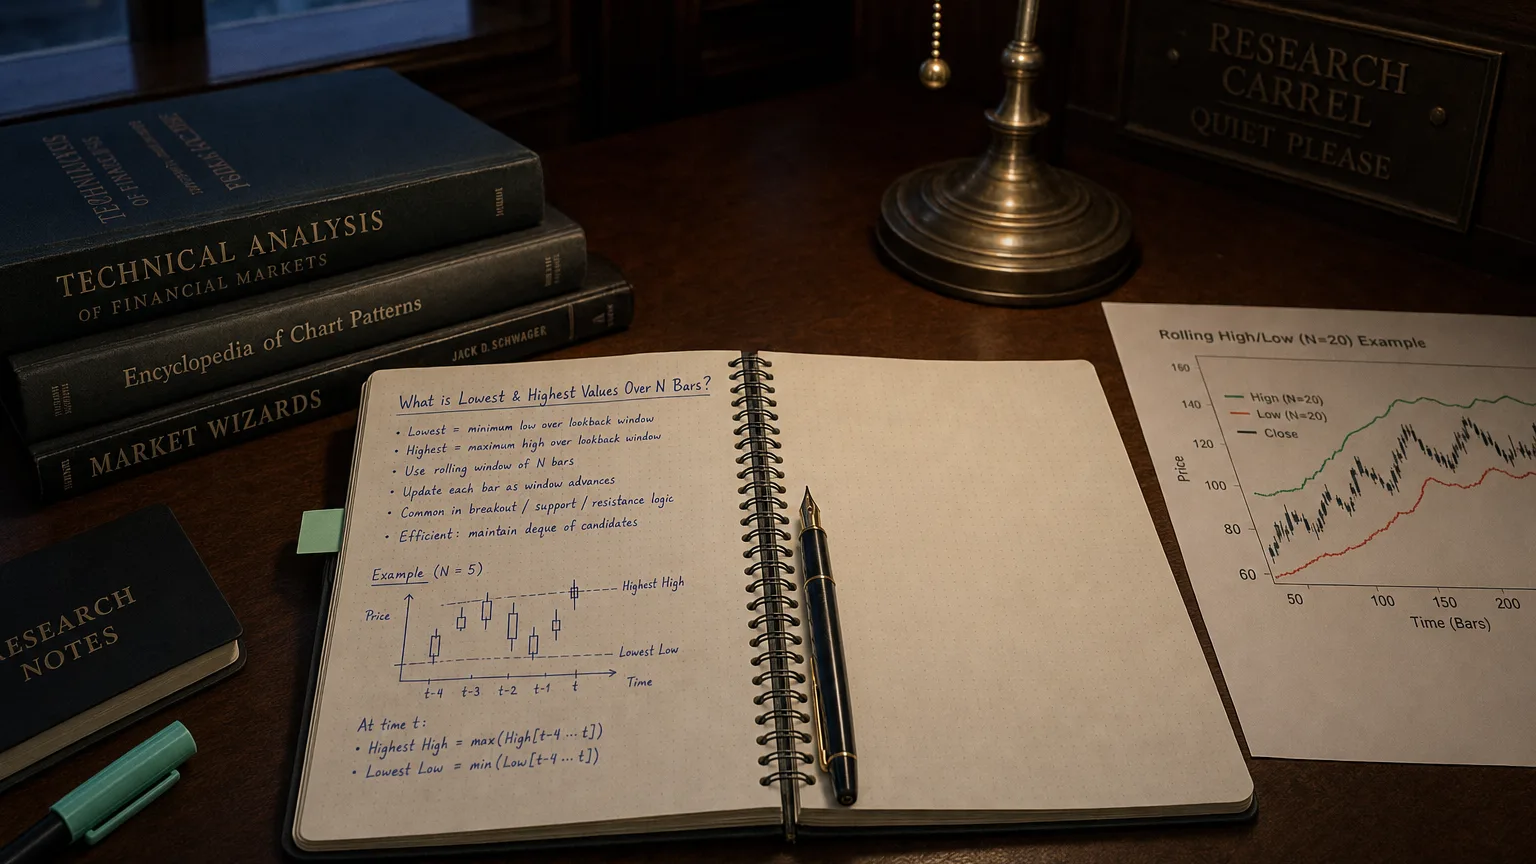
What the LLV Indicator Does
The Lowest-Low Value (often just LLV) outputs the minimum price witnessed within a rolling look-back window of N bars.
-
On a daily chart with N = 20, LLV marks the lowest price hit in the last 20 sessions, updating each new bar.
-
Works on the Low series by default, but can be applied to Close, volume, or even another indicator’s readings.
Think of LLV as the market’s “recent floor”—a dynamic support reference that slides forward with time.
Straight-Line Formula
(Formula — visualization pending)
Where (formula) = Low price and (formula) = look-back length.
Interpreting LLV
| LLV Behavior | Market Insight | Typical Tactics |
|---|---|---|
| Price drops below LLV | Fresh N-bar low → bearish breakout | Enter shorts; stop just above old LLV |
| LLV flat | Range-bound floor | Fade dips near LLV or wait for breakdown |
| LLV stair-steps down | Lower-low sequence → down-trend confirmation | Ride shorts; trail stop above LLV plus buffer |
| LLV slopes up | Successive higher lows (if using Close) | Early sign of base building; prep for reversal |
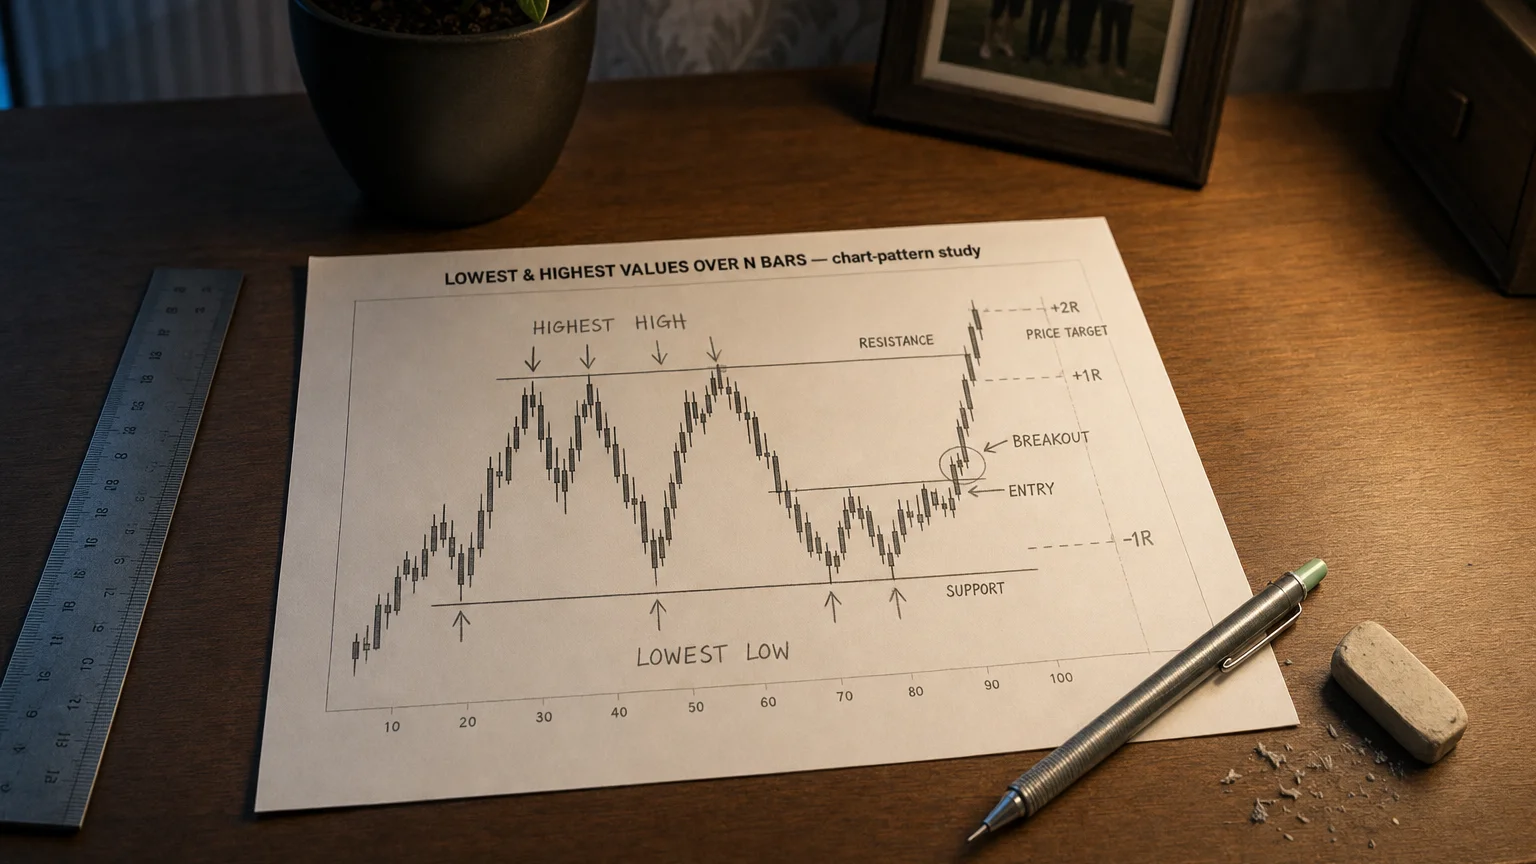
Classic Uses
| Setup | LLV’s Role |
|---|---|
| Donchian Channels (Bottom Band) | LLV(N) of Low for breakdown entries |
| Trailing Stop for Shorts | Ratchet stop above LLV(N) × k to lock gains |
| Oversold Scan | Spot assets hitting 52-week (252-day) LLV lows |
| Trend Confirmation | Require price < LLV(50) before initiating pullback shorts |
Parameter Cheat-Sheet
| Look-Back N | Feel | Best For |
|---|---|---|
| 5–10 | Hyper-responsive; many signals | Day-trading or scalp setups |
| 20–55 | Balance noise vs. lag | Swing trades in FX & equities |
| 100–252 | Macro floors | Position trades, yearly breakdown scans |
Strategy Playbook
- Donchian Breakdown
-
Compute LowerBand = LLV(20), UpperBand = HHV(20).
-
Short when close < LowerBand; cover when close rises above UpperBand or via ATR stop.
- Pullback-in-Downtrend
-
Confirm price < LLV(50).
-
Sell rallies to 20-EMA.
-
Place initial stop above recent LLV step.
- 52-Week Lows Value Hunt
-
Screen weekly charts for close within 1 % of LLV(252).
-
Combine with volume exhaustion to identify potential capitulation bottoms.
Strengths & Limitations
| Strengths | Limitations |
|---|---|
| Zero lag on identifying actual lows | Sensitive to one-bar “flash crash” spikes |
| Lightning-fast to compute, visualize | Alone, offers no directional clues in chop |
| Essential component of proven turtle/Donchian systems | Purely price-based — add momentum/vol filters |
| Complements LLV’s sibling indicators (HHV, IHV, ILV) | Flat-lines during persistent up-trends |
Implementation Checklist
-
Match N to your trading horizon (e.g., 20 for monthly swings).
-
Overlay LLV with HHV to map ranges clearly.
-
Back-test breakdown, fade, and stop rules using LLV anchor.
-
Layer filters — ATR, volume, or momentum (RSI, MACD) confirmations.
-
Set alerts for price ≤ LLV(N) and LLV step changes.
-
Adjust quarterly — lengthen N if false breaks surge; shorten if late to moves.
Bottom Line
The Lowest-Low Value indicator shines a spotlight on the market’s freshest support level. Whether you’re trading Donchian-style breakouts, setting dynamic stops, or hunting capitulation lows, LLV keeps your focus fixed on the true floor of recent price action. Watch the floor, manage your risk, and let your trades groove in harmony with downside dynamics. Rock on!
Q · 01What is Lowest & Highest Values over N Bars?+