is a financial concept covered in this article. The Rolling Fair-Value Line That Centers the Recent Range
The goal of a successful trader is to make the best trades. Money is secondary.

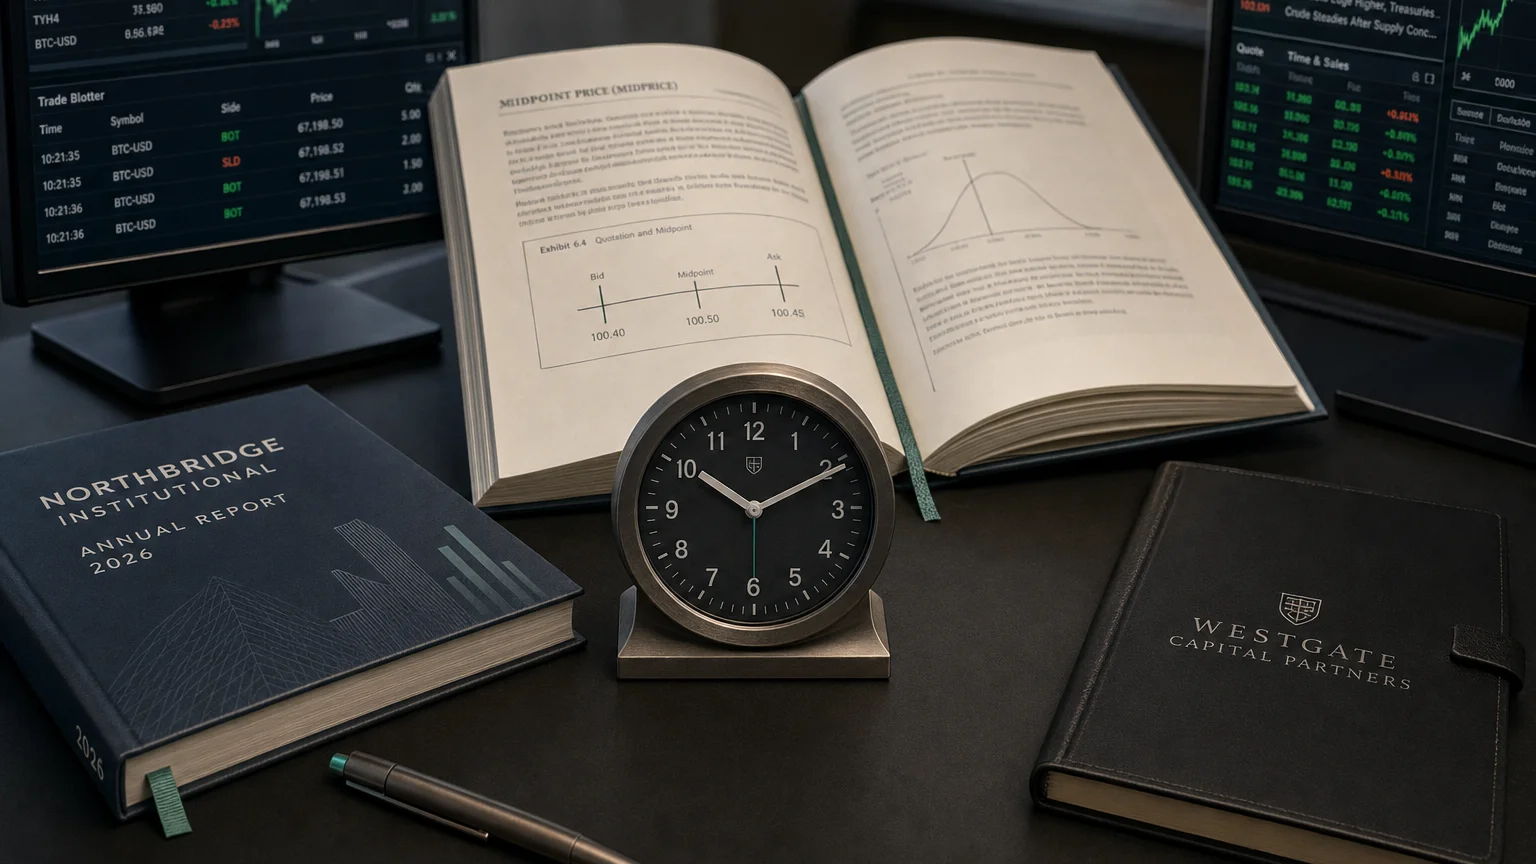
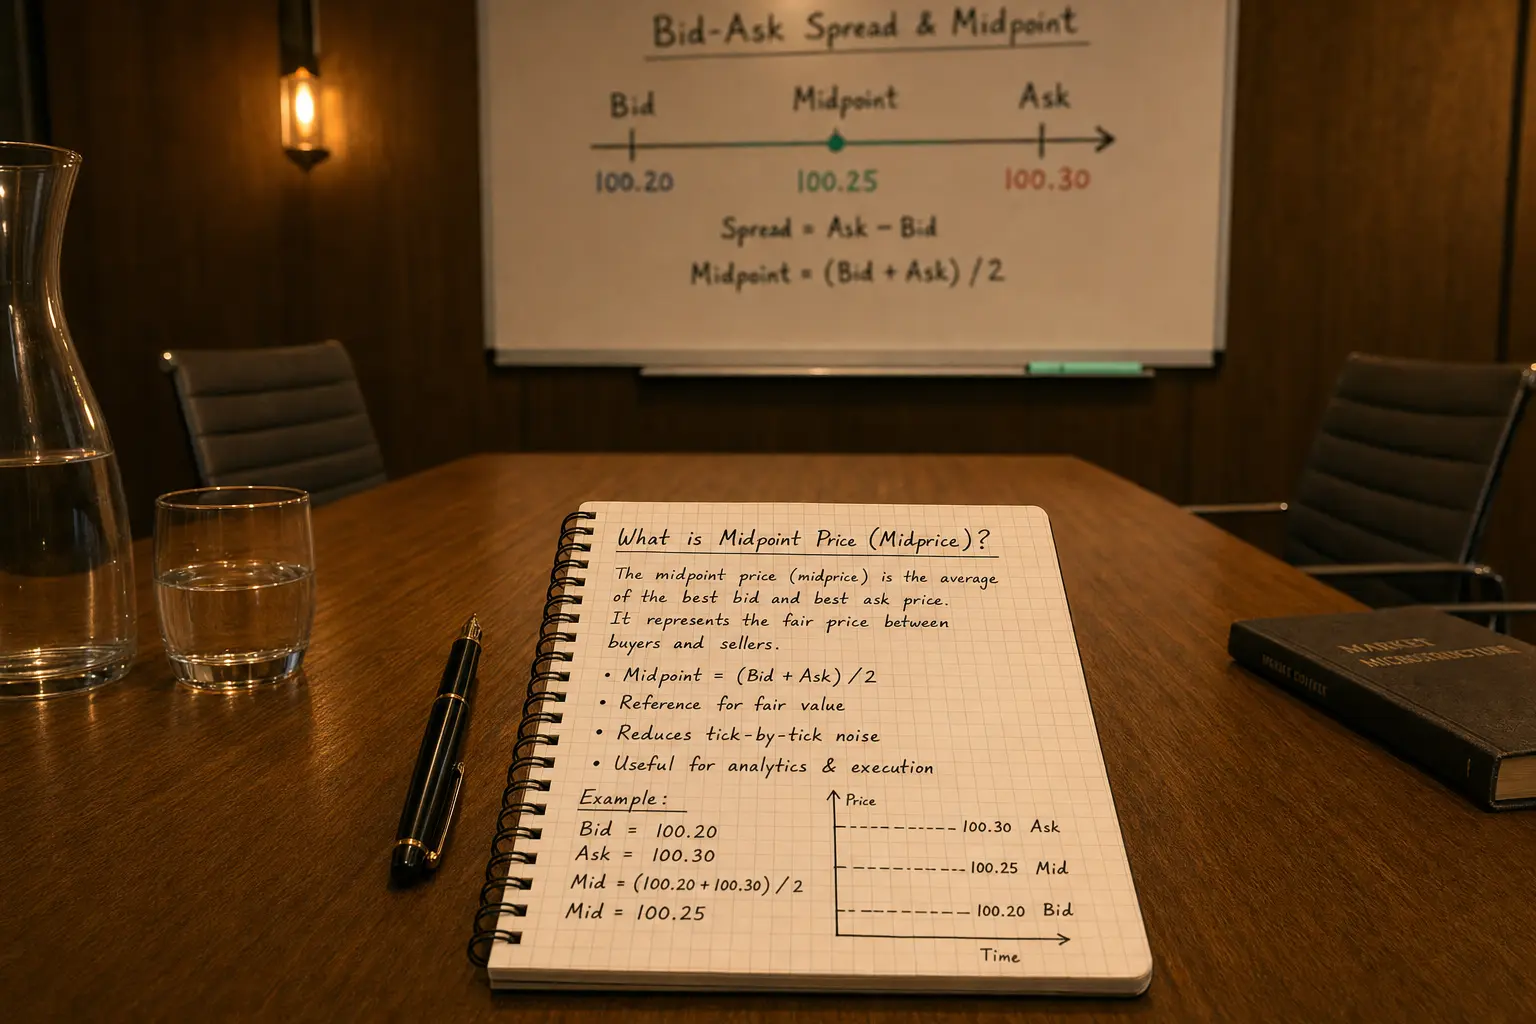
Midpoint Price over N bars finds the exact center of each bar’s highest high and lowest low inside a moving window, then plots that center as a single line.
-
Purpose: Reveal where recent trading has balanced out — the “equilibrium” of the entire high-low range, not just the latest close.
-
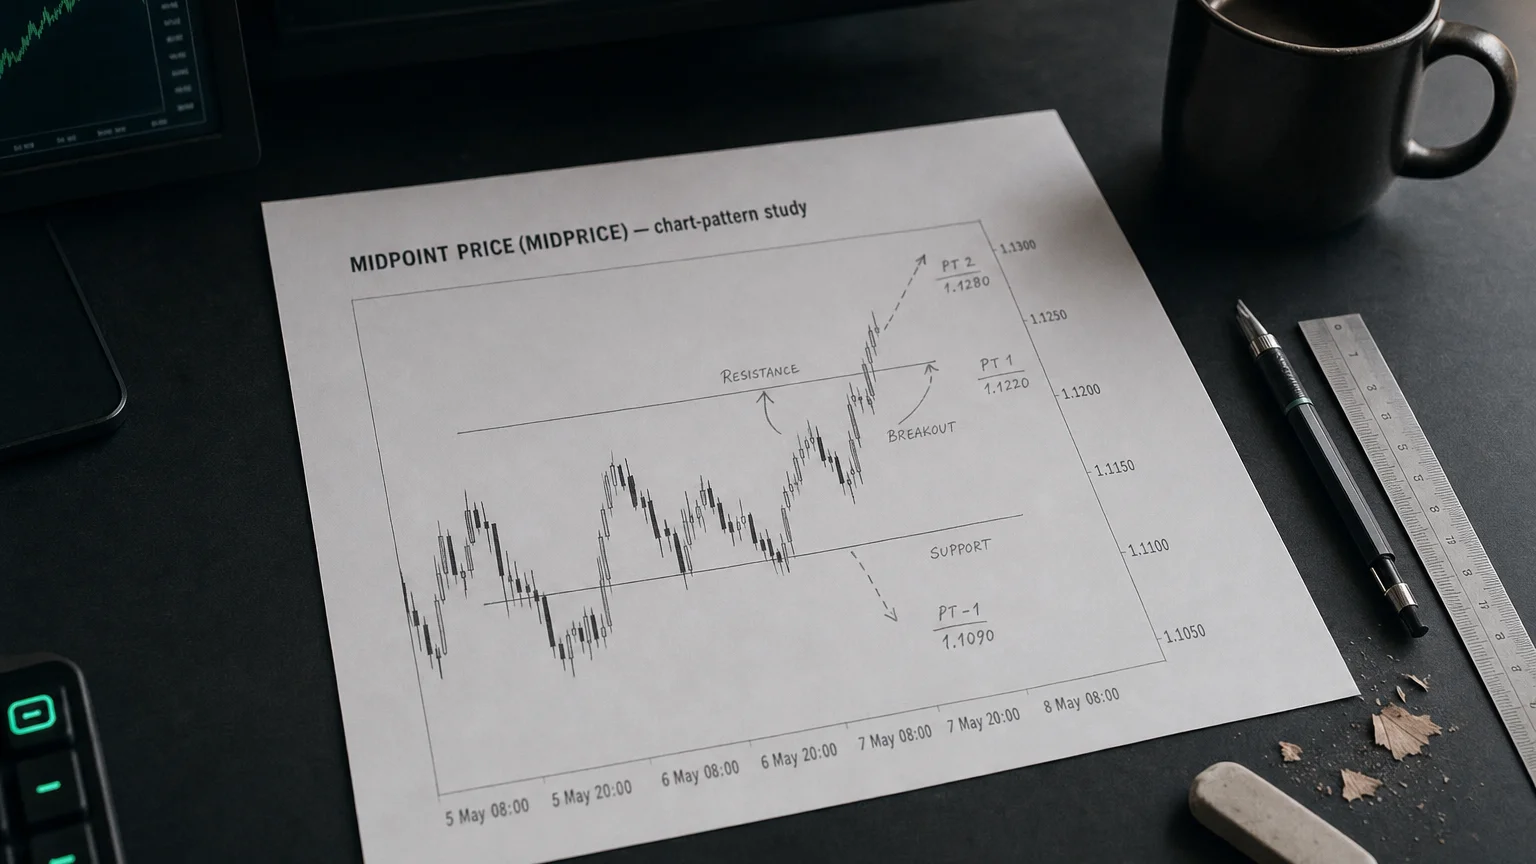
Key Insight: If price hugs the top half of its window while MIDPRICE drifts upward, buyers are absorbing supply; the reverse signals seller control.
The Straight-Line Formula
(Formula — visualization pending)
| Symbol | Meaning |
|---|---|
| HHH | High price series |
| LLL | Low price series |
| NNN | Look-back length (default 14) |
No smoothing, no weights — just the midpoint of the rolling price envelope.
Reading the Line
| Price vs. MIDPRICE | Market Message | Typical Plays |
|---|---|---|
| Price > MIDPRICE | Trading in the upper half of the recent range | Bias long; pullbacks to the line ≈ support |
| Price < MIDPRICE | Trading in the lower half | Bias short; bounces into the line ≈ resistance |
| MIDPRICE rising | Range itself is drifting up | Ride trend, trail stops under MIDPRICE |
| MIDPRICE flat | Horizontal balance; range market | Favor mean-reversion: fade extremes, target MIDPRICE |
| Sharp MIDPRICE bend | Sudden range expansion or contraction | Watch for breakout or volatility squeeze |
How Traders Use It
| Application | Practical Role |
|---|---|
| Range Mapping | Centerline inside Donchian or ATR channels |
| Breakout Filters | Enter only if price closes outside range and stays above rising MIDPRICE |
| Dynamic Pivots | Substitute for classical floor pivots on intraday charts |
| Stop Management | Trail stop a fixed buffer below rising MIDPRICE (vice-versa for shorts) |
| Indicator Input | Feed MIDPRICE into RSI/Stoch to reduce tail-whip noise |
Parameter Tweaks
| Length NNN | Feel | Best-Fit Scenarios |
|---|---|---|
| 5–10 | Snappy, tracks micro-swings | Scalping 1-min/5-min charts |
| 14–30 | Balanced, swing friendly | Daily FX or equity swings |
| 50–100 | Macro center of gravity | Weekly position trades, crypto trend holds |
Guideline: set NNN ≈ the swing cycle you care about (20 ≈ one trading month).
Strategy Sketches
- Range-Fade System
-
Plot Donchian 20 High/Low plus MIDPRICE(20).
-
Buy near LowerBand when price prints bullish reversal & MIDPRICE is flat.
-
Target MIDPRICE; stop a few ticks under the range.
- Break–Retest Trend Entry
-
Price closes above Donchian UpperBand.
-
Wait for pullback that holds above MIDPRICE(20).
-
Enter on bullish candle; stop below MIDPRICE minus ATR buffer.
- Volatility Compression Alert
-
Compare range width (High–Low) to historical average.
-
When width collapses and MIDPRICE coils flat, prep for explosive move.
Strengths & Limitations
| Strengths | Caveats |
|---|---|
| Zero-lag on defining true range center | Very sensitive to single outlier spikes |
| Works on any timeframe / asset | Gives direction only in context of price relationship |
| Simple to compute & visualize | Flat during strong uni-directional trends; needs companion signals |
| Powerful inside range & breakout systems | Not volume-aware; combine with OBV/MFI for confirmation |
Implementation Checklist
-
Pick NNN aligned with your trading horizon.
-
Overlay Donchian, ATR, or Keltner bands for range context.
-
Back-test bounce, breakout, and stop rules with MIDPRICE anchor.
-
Add filters – higher-TF trend, volume surge, or momentum oscillator.
-
Set alerts – price cross of MIDPRICE, slope flips, range-width squeezes.
-
Review quarterly – widen NNN in high-vol regimes, shorten in dull markets.
Final Takeaway
The Midpoint Price over period is your chart’s bull-bear equator — a dynamic, parameter-light line that shows where the recent tug-of-war has balanced out. Whether you’re fading range extremes, managing stops, or timing breakouts, MIDPRICE keeps you centered on the market’s most neutral reference point.
Find the middle, play the edges, and keep your trades in tune. Rock on!
Q · 01What is Midpoint Price Midprice The Rolling Fair Value Gauge?+