is a financial concept covered in this article. The Balanced Intraday Average That Powers Volume-Weighted Tools
The goal of a successful trader is to make the best trades. Money is secondary.

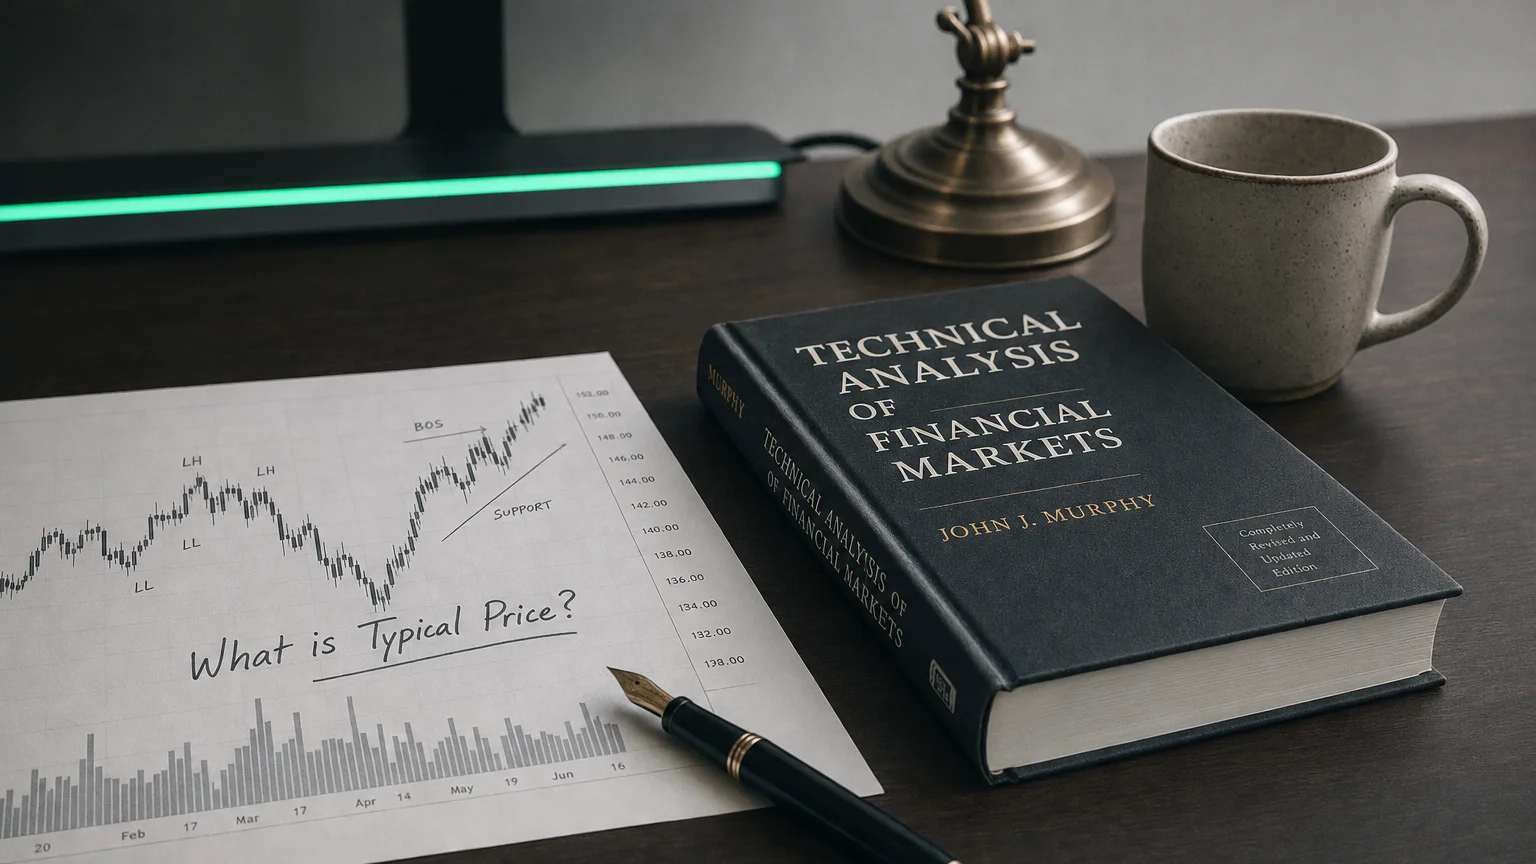
The Typical Price – often just called TP – is a straightforward average of the three most important price points in a trading period: high, low, and close. By giving equal weight to the session’s extreme and final price, it creates a smoother, more representative ‘center’ than using close alone. It’s the go-to input for many volume-weighted indicators (like Money Flow Index and Chaikin tools) because it captures the full range while emphasizing where the action settled. Simple, noise-reducing, and a quiet hero in advanced analysis.
The Simple Formula
“The goal of a successful trader is to make the best trades. Money is secondary.”
— Alexander Elder, Author, Trading for a Living Trading for a Living (1993)
Nothing complicated:
Typical Price = \frac{High + Low + Close}{3}
Each bar gets one balanced value – the mathematical middle of the session’s action.
Why Typical Price Beats Close Alone
Key advantages:
- Includes full range: Captures extremes, not just final print.
- Reduces noise: Smoother line than raw closes.
- Better volume weighting: When multiplied by volume, reflects true participation across the day.
- Fairer average: Close can be manipulated; TP dilutes end-of-day spikes.
Practical Interpretations
What to watch:
- Price > rising TP: Close in upper range – bullish intraday control.
- Price < falling TP: Close in lower range – bearish pressure.
- TP flattening: Consolidation – price finding equilibrium.
- TP as pivot: Often acts as soft support/resistance in short-term moves.
Plot as a line – smoother alternative to close for visual trend spotting.
Pro Applications
Where it really earns its keep:
- Volume indicators: Core input for MFI, Chaikin Money Flow, and Accumulation/Distribution.
- Mean reversion: Price far from TP line → potential snap back.
- Smoothing base: Use TP series instead of close for cleaner MAs or oscillators.
- Institutional reference: Better benchmark than close for intraday execution.
Many pros prefer TP over close for volume-weighted calculations – more representative participation.
Strengths and Natural Limits
The Wins
- Balanced, noise-reduced price representation.
- Essential building block for advanced volume tools.
- Smoother than close, includes full session range.
- Simple and universally available.
The Gotchas
- Still backward-looking – no predictive power alone.
- No volume built-in – just price average.
- Soft levels – rarely strong S/R without confirmation.
- Ignores open price (unlike some weighted averages).
Your Typical Price Quick-Start
- Plot TP line on any chart.
- Watch price vs TP for intraday bias.
- Use as input for MFI/Chaikin indicators.
- Combine with volume for money flow insight.
- Treat as short-term pivot or reversion zone.
- Great smoother alternative to raw close.