The Breakaway Candlestick Pattern is a five-candle reversal. Candles 1–3 extend the trend with fading momentum, candle 4 prints an indecision candle, and candle 5 surges in the opposite direction — closing inside candle 1's body and confirming a momentum transfer.
There is nothing new on Wall Street or in stock speculation. What has happened in the past will happen again and again.

The Breakaway Pattern is a five-candle trend reversal formation that signals a strong shift in market momentum — either from bullish to bearish or bearish to bullish. It forms after a prolonged trend and reflects exhaustion, momentum stall, and ultimately, a complete reversal of control.
This is not a common pattern — but when it appears, it’s like a pressure valve bursting. It tells you that one side (bulls or bears) has overextended and the other is about to counterattack with force.
Structure of the Breakaway Pattern
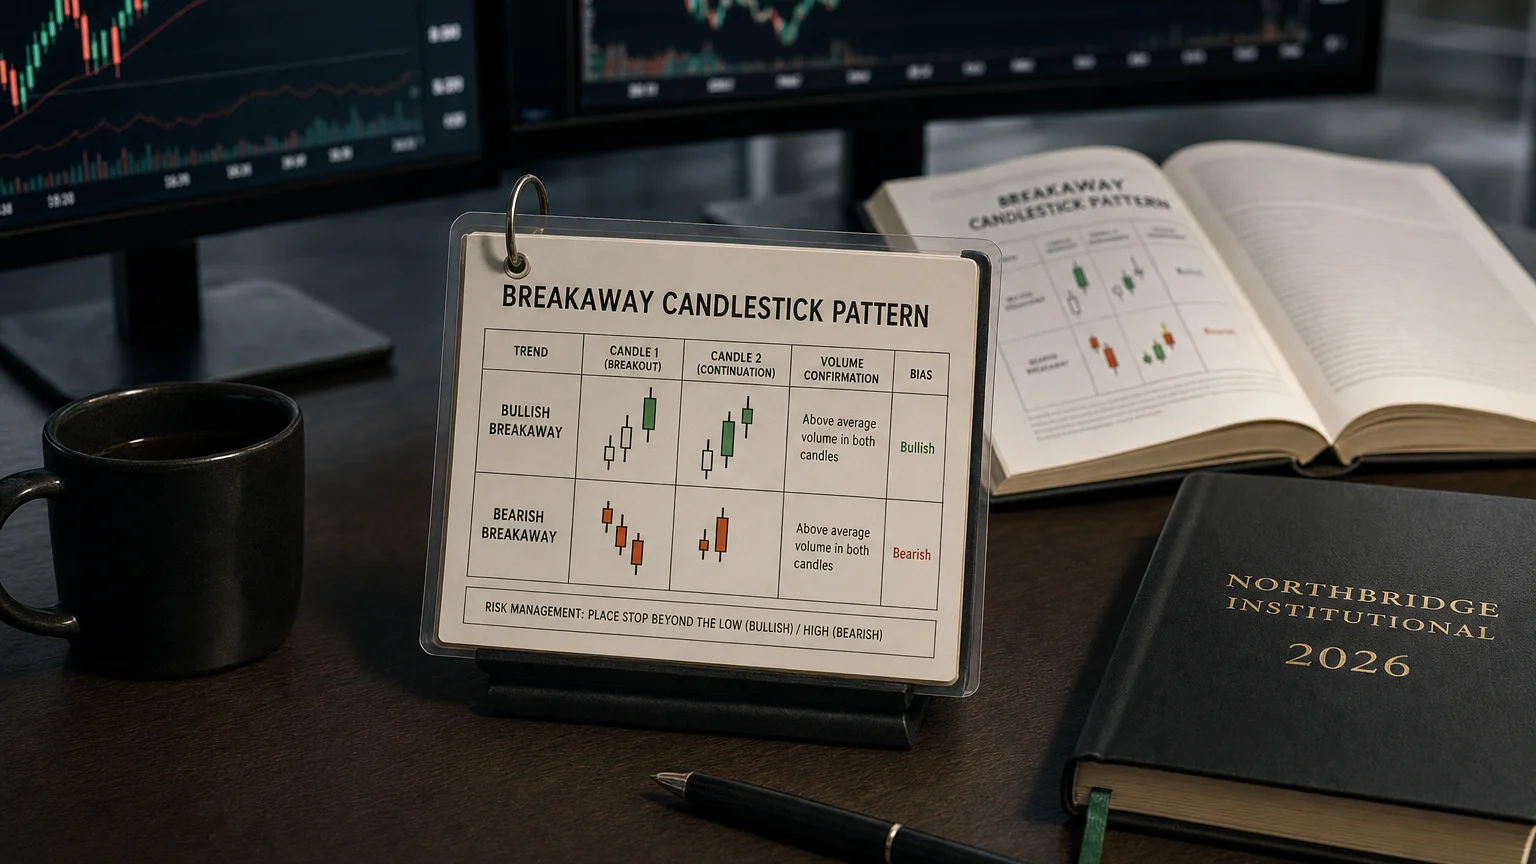
There are two versions: Bullish Breakaway (reversal up) and Bearish Breakaway (reversal down). Let’s break them down:
Bullish Breakaway Pattern (Occurs after a downtrend)
-
Candle 1 – Strong bearish candle, continuing the trend.
-
Candle 2 – Another bearish candle, pushing lower.
-
Candle 3 – Smaller bearish candle, momentum starts to slow.
-
Candle 4 – Doji or small-bodied candle — indecision creeps in.
-
Candle 5 – Strong bullish candle that closes within the body of the first candle — reversal confirmed.
Bearish Breakaway Pattern (Occurs after an uptrend)
-
Candle 1 – Strong bullish candle, trend continuation.
-
Candle 2 – Another bullish candle, but with signs of hesitation.
-
Candle 3 – Smaller bullish candle, upward momentum fading.
-
Candle 4 – Indecision candle or doji, market stalls.
-
Candle 5 – Long bearish candle that closes deep into the body of Candle 1 — boom! Reversal signal.
Interpretation and Sentiment Shift
| Phase | What It Tells Us |
|---|---|
| First 2–3 candles | Trend continuation — bulls/bears still in control |
| 4th candle | Momentum stalling — market hesitation |
| 5th candle | Reversal aggression — opposite side takes over |
| Volume (optional) | If volume spikes on the 5th candle, it confirms institutional interest |
This pattern captures the full evolution of a trend turning over, with a clear storyline: dominance, slowdown, stall, reversal.
Strategic Use Cases
-
Trend Reversal Trading
- This is a textbook entry for counter-trend trades or swing setups.
-
Volume-Based Confirmation
- Use in tandem with volume spikes or OBV divergence to validate the reversal.
-
Options & Risk Management
- Ideal trigger for initiating directional options trades, like puts or calls, or for hedging directional exposure.
-
Pattern-Driven Backtesting
- Due to its multi-bar structure, Breakaway is a favorite in backtested multi-candle signal models.
Professional Applications
-
Institutional Pattern Libraries: Recognized in quant libraries for high-conviction reversal mapping.
-
AI/ML Trading Models: Structured perfectly for supervised learning classification sets.
-
Reversal Zones in Portfolio Management: Used to time rebalancing, hedging, or risk rotation.
-
Multi-Timeframe Analysis: Especially powerful when it shows up on daily/weekly charts near macro levels.
Limitations
-
Rare: This pattern doesn’t show up every day — it’s a precision tool, not a scalpel for every candle.
-
Confirmation needed: Watch for a break above/below the 5th candle on follow-through for confirmation.
-
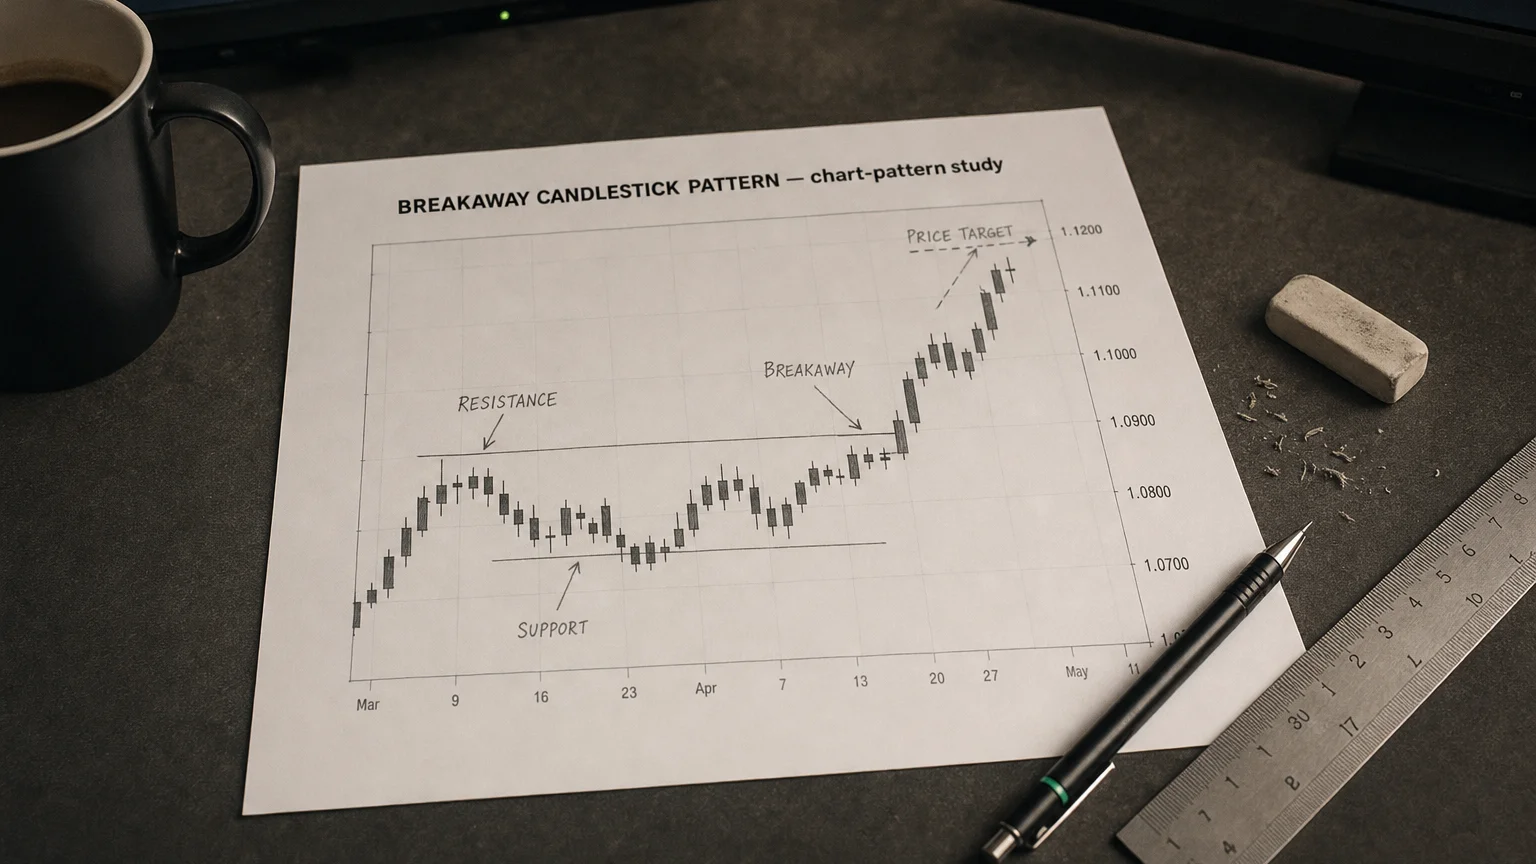
Context is key: It’s strongest after an extended trend or exhaustion gap, not inside tight consolidations.
Summary
The Breakaway Pattern is a multi-stage, high-conviction reversal signal that captures a trend’s last breath and the spark of new momentum. It’s strategic, structured, and surgical — and when paired with volume and broader technical confluence, it’s one of the most potent reversal setups in your arsenal.
Q · 01How do you confirm a Breakaway Candlestick Pattern?+
Q · 02What makes the Breakaway Pattern different from other reversals?+
Q · 03Can the Breakaway Pattern be used in algorithmic trading?+