
is a financial concept covered in this article. The Real-Time Tape Measure of the Market's Hidden Rhythm
There is nothing new on Wall Street or in stock speculation. What has happened in the past will happen again and again.

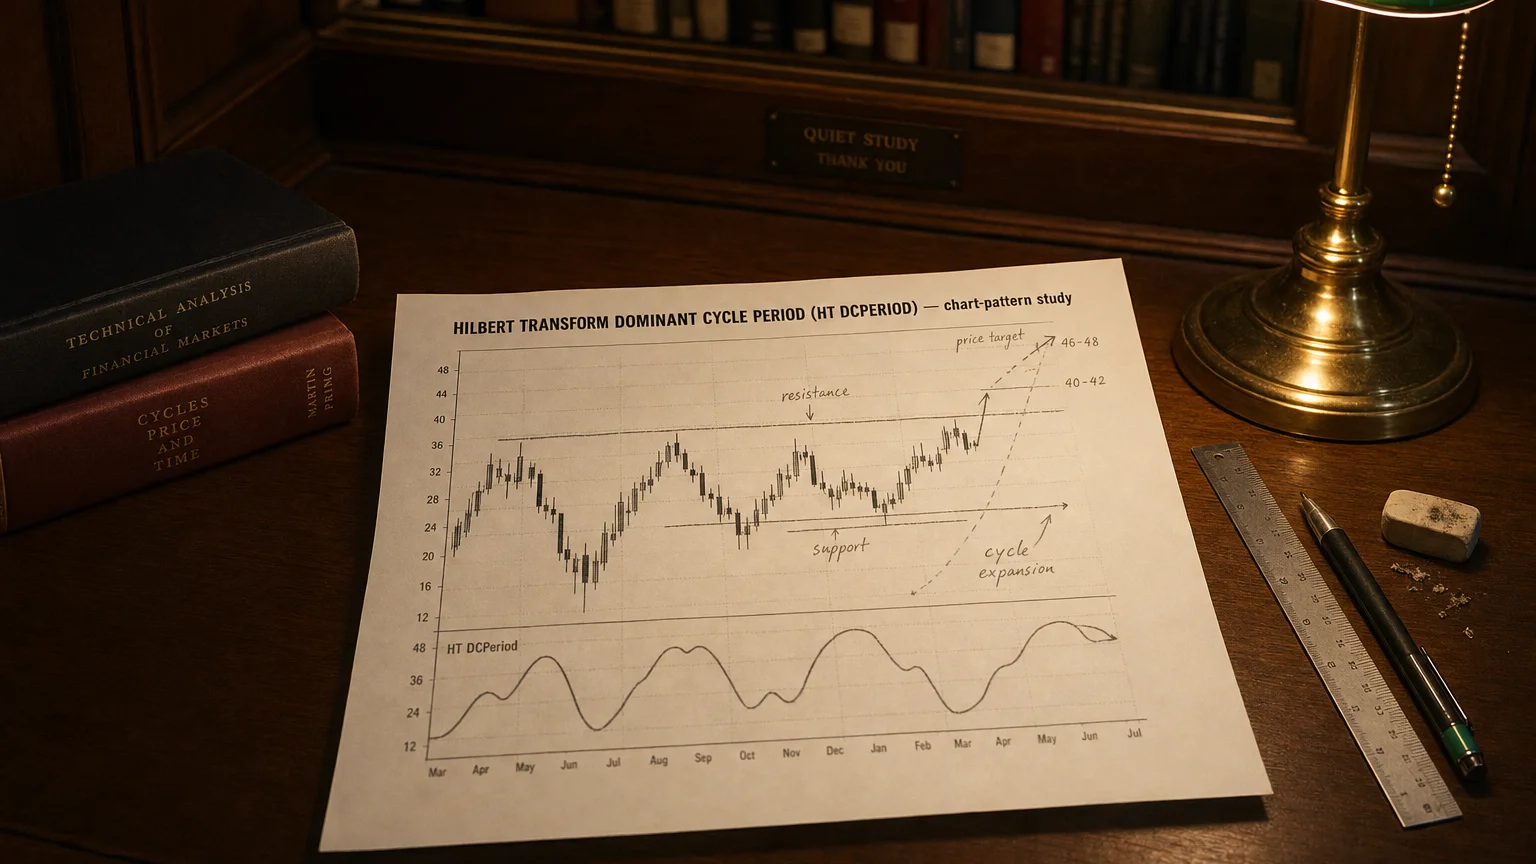
John F. Ehlers introduced the Hilbert Transform Dominant Cycle Period in the early-2000s as part of his quest to bring DSP (digital-signal processing) rigor to technical analysis.
Problem solved: classic oscillators use fixed look-backs and lag when the market’s cyclical wavelength changes; HT DCPERIOD measures the market’s current dominant cycle length so other tools (e.g., adaptive moving averages, entry windows) can rescale themselves on the fly.
How it’s calculated – high-level flow
-
Detrend price with an EMA or high-pass filter to remove slow drift.
-
Apply the discrete Hilbert Transform (via a 3-tap quadrature filter) to obtain the real component InPhase and the imaginary component Quadrature.
-
Compute the instantaneous phase angle:
(Formula — visualization pending)
-
Track phase change Δφ between bars; one complete 360° sweep equals one cycle.
-
Dominant period at bar t:
(Formula — visualization pending)
(capped to practical bounds, 6–50 bars)
Wilder-style smoothing (α = 0.07–0.2) tames jitter. Most charting APIs (e.g., TA-Lib HT_DCPERIOD) handle the heavy lifting internally.
Practical interpretation
| Reading | Tactical message |
|---|---|
| Rising DCPERIOD | Cycles lengthening → trend strength increasing / volatility contracting. |
| Falling DCPERIOD | Cycles shortening → choppier action / volatility expanding. |
| Stable plateau | Market locked into a fairly steady wavelength; adaptive tools can “lock in” to that period. |
Rule of thumb: use ½ the period as the optimum look-back for momentum oscillators, and the full period for smoothing filters.
Trading applications
| Module | How it plugs in |
|---|---|
| Adaptive Moving Average | Length = α × DCPERIOD (e.g., Ehlers’ MAMA, FRAMA). |
| Adaptive RSI/Stoch | Momentum window = ⌊½ × DCPERIOD⌋. |
| Cycle swing entry | Long when price crosses the cycle trough with DCPERIOD > 8 and rising; exit near the calculated crest timing. |
| Volatility regimes | Keep trend-following systems active only when DCPERIOD ≥ 20; switch to mean-revert when < 12. |
Strengths
-
Market-adaptive: automatically lengthens in slow, trending markets and shortens in fast, choppy ones.
-
Forward-looking: relies on instantaneous phase, not laggy highs/lows.
-
Versatile anchor: feeds directly into other adaptive indicators without subjective parameter picking.
Limitations & watch-outs
-
Complex maths: opaque to many discretionary traders; debugging custom code can be tricky.
-
Edge cases: very low-volume or gappy data distort the quadrature filter → erratic periods.
-
No stand-alone signal: DCPERIOD is a diagnostic; you still need entry/exit rules driven by price or a derivative oscillator.
-
Initialization lag: requires ~50 bars of data before readings stabilise.
Implementation cheat-sheet
-
Feed median price (High+Low)/2 to reduce noise.
-
Bounds – clamp output 6 ≤ DCPERIOD ≤ 50 to avoid runaway spikes.
-
Smooth with an EMA(5) to get DPSMOOTH, which is what most traders plot.
-
Update dependent indicators each bar with the latest period value.
Take-away
The Hilbert Transform – Dominant Cycle Period turns raw price into a real-time “tape measure” of the market’s prevailing wavelength. Use that dynamic period to retune moving averages, oscillators, and swing-timing rules on the fly, giving your strategy the agility to follow trends when they breathe slowly and to duck whipsaws when they speed up. Handle the math through platform libraries, respect its diagnostic nature, and the DCPERIOD can super-charge any adaptive trading framework while keeping lag on a tight leash. Rock on and manage that risk!
Q · 01What is Hilbert Transform Dominant Cycle Period Ht Dcperiod?+