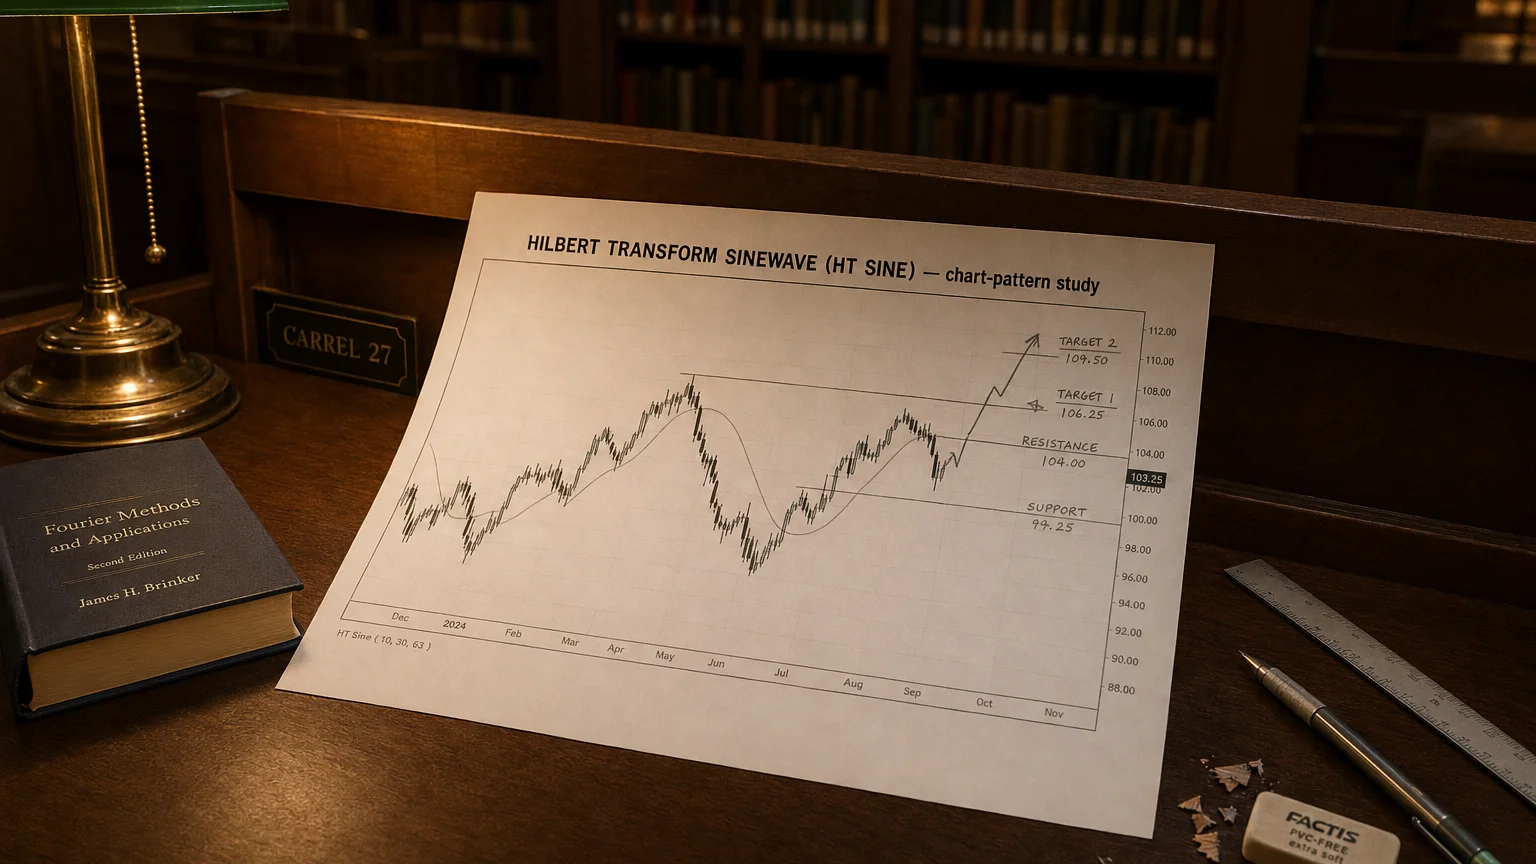
Hilbert Transform SineWave (HT SINE) is a financial concept covered in this article. The Adaptive Cycle Oscillator That Tunes Itself to Market Rhythm
There is nothing new on Wall Street or in stock speculation. What has happened in the past will happen again and again.

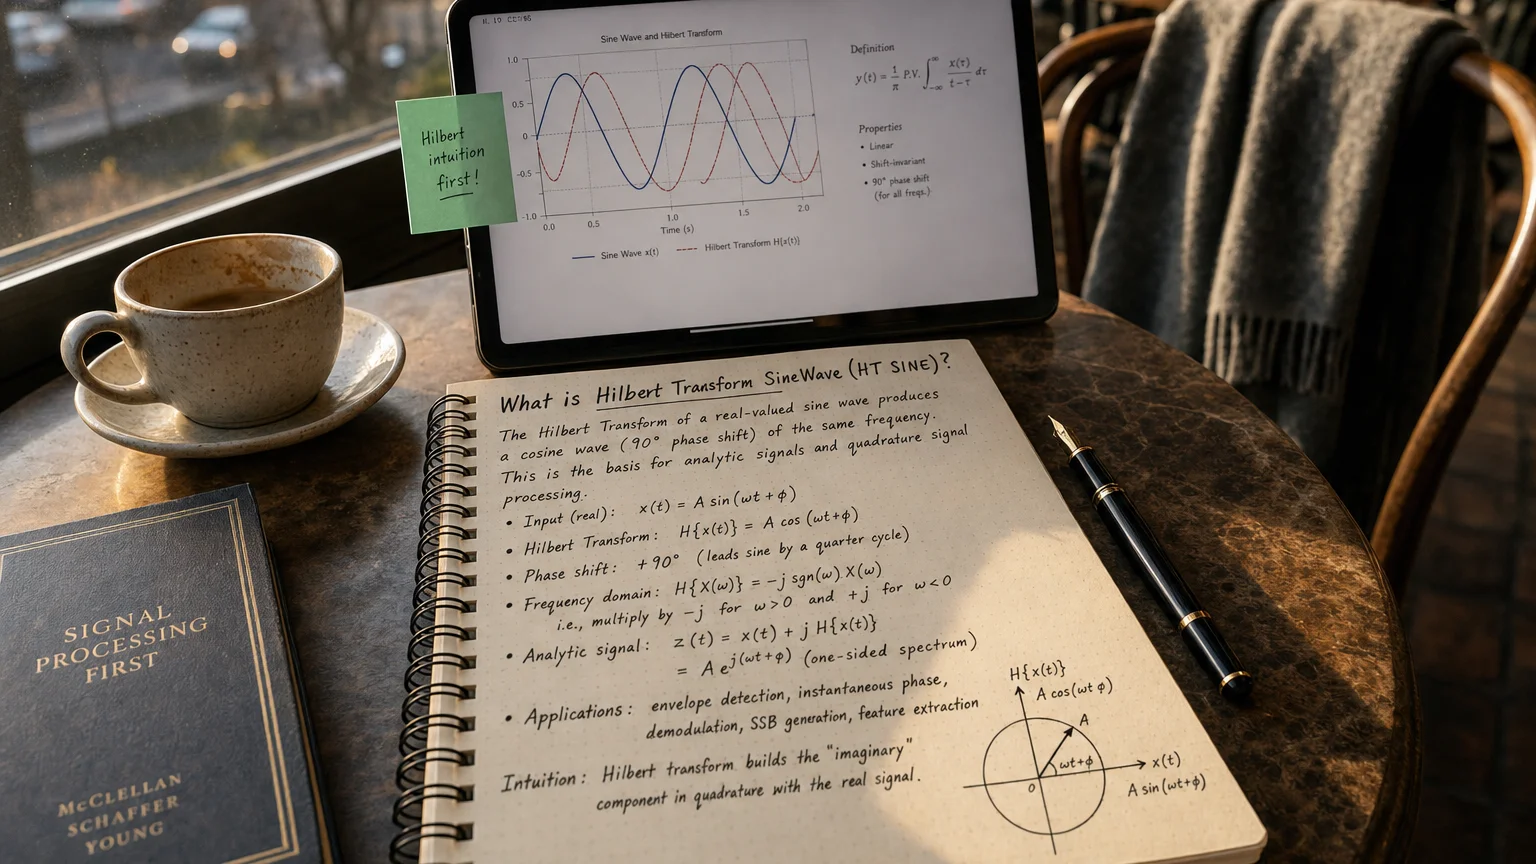
The Hilbert Transform SineWave often thought of as a DSP-derived oscillator for cycle-timed entries and trend filters, is John Ehlers’ attempt to show a market’s dominant cycle in the most intuitive form possible: two smooth sine-curves that rise and fall in real time with price. By first detrending price and then feeding it through a discrete Hilbert transform, the algorithm extracts the signal’s instantaneous phase. Plotting (formula) together with an advance of (Formula — visualization pending) turns that abstract phase data into a familiar oscillator.
-
When the curves climb through zero, the market is leaving a cycle trough;
-
when they crest above +1 or dive below −1, the trend is so strong that normal cyclic swings are stretched;
-
when LEADSINE crosses SINE you get an early heads-up that a zero-line crossing—and thus a swing turn—lies just ahead.
Because the underlying phase adapts bar-by-bar, HT SineWave adjusts automatically to shorter rhythms in choppy markets and to longer wavelengths in slow trends, eliminating the need for fixed look-back settings. Used as a timing overlay—ideally confirmed by price structure or volatility filters—it helps traders enter near troughs, exit near peaks, and stay out when the market’s pulse is too weak or too distorted to trust.
Purpose & heritage
John F. Ehlers designed the Hilbert Transform SineWave to display the market’s dominant cycle in the familiar form of two smooth sinusoids:
-
(formula)
-
(Formula — visualization pending)
where φt\varphi_tφt is the instantaneous phase angle extracted from the analytic signal of price. Plotting these curves lets traders see at a glance whether price is in an upswing (SINE rising through zero), downswing, or transition zone. Unlike fixed-length oscillators, the wavelength of HT SINE adapts automatically to the market’s changing rhythm.
Mathematical construction
- Detrend price
(Formula — visualization pending)
- Generate In-Phase / Quadrature pairs (see phasor module)
(Formula — visualization pending)
- Advance the phase by 90° (to align components):
(Formula — visualization pending)
- Compute instantaneous phase
(Formula — visualization pending)
Phase unwrapped so it flows smoothly.
- Output the sinusoid pair
(Formula — visualization pending)
Reading the oscillator
| Pattern | Interpretation | Tactical cue |
|---|---|---|
| SINE crosses zero upward (SINE = 0, rising) | Cycle trough → start of upswing | Potential long seed |
| SINE crosses zero downward | Cycle peak → start of downswing | Potential short seed |
| LEADSINE leads by 45° | Gives an early alert of upcoming SINE cross | Anticipatory timing |
| SINE & LEADSINE glued around ±1 | Trend dominant; cycles stretched | Filter out counter-trend signals |
Rule of thumb: Trade only SINE zero-crossings that occur while the two curves are separated (divergent); ignore when they are tangled near zero (noisy range).
Typical trading frameworks
1 Cycle-timed swing system
-
Buy when LEADSINE crosses SINE from below and both are below –0.5.
-
Sell/short on the mirror condition above +0.5.
-
Exit when SINE reverses to the opposite side or after a pre-set R-multiple.
2 Trend filter
-
Enable moving-average cross strategy only when |SINE| < 0.5 (trend dormant → cycles visible).
-
Disable when |SINE| > 0.75 (trend dominant → oscillator less reliable).
3 Adaptive stop
- Trail a stop at the most recent price low formed near a SINE trough; ratchet it each time a new trough appears.
Strengths
-
Automatic wavelength detection – no fixed look-back guesswork.
-
Low lag – phase updates every bar; SINE mirrors real-time turning points.
-
Clear visuals – sinusoids are easy to read; zero-line acts as objective trigger.
Limitations
-
Needs clean data – spikes or gaps distort phase; pre-smooth with median filter.
-
Whipsaws in strong trends – when cycles stretch, SINE may hug ±1 for long periods; use a trend/volatility filter.
-
Warm-up window – ignore first ~50 bars to let the Hilbert pair stabilise.
Key Take-Away
The Hilbert Transform SineWave converts price into a pair of adaptive sinusoids that lay bare the market’s dominant cycle—its rhythm and turning points—without the lag of fixed-length oscillators. Time longs on SINE up-crosses, shorts on down-crosses, and blend amplitude or trend filters to avoid chop. Treat it as a cycle-timing overlay, not a standalone system, and you’ll keep your trades in sync with the pulse of the market. Rock on and manage that risk!
Q · 01What is Hilbert Transform Sinewave Ht Sine?+