is a financial concept covered in this article. A Powerful Two-Candle Reversal Pattern Signaling Dramatic Sentiment Shifts
The goal of a successful trader is to make the best trades. Money is secondary.

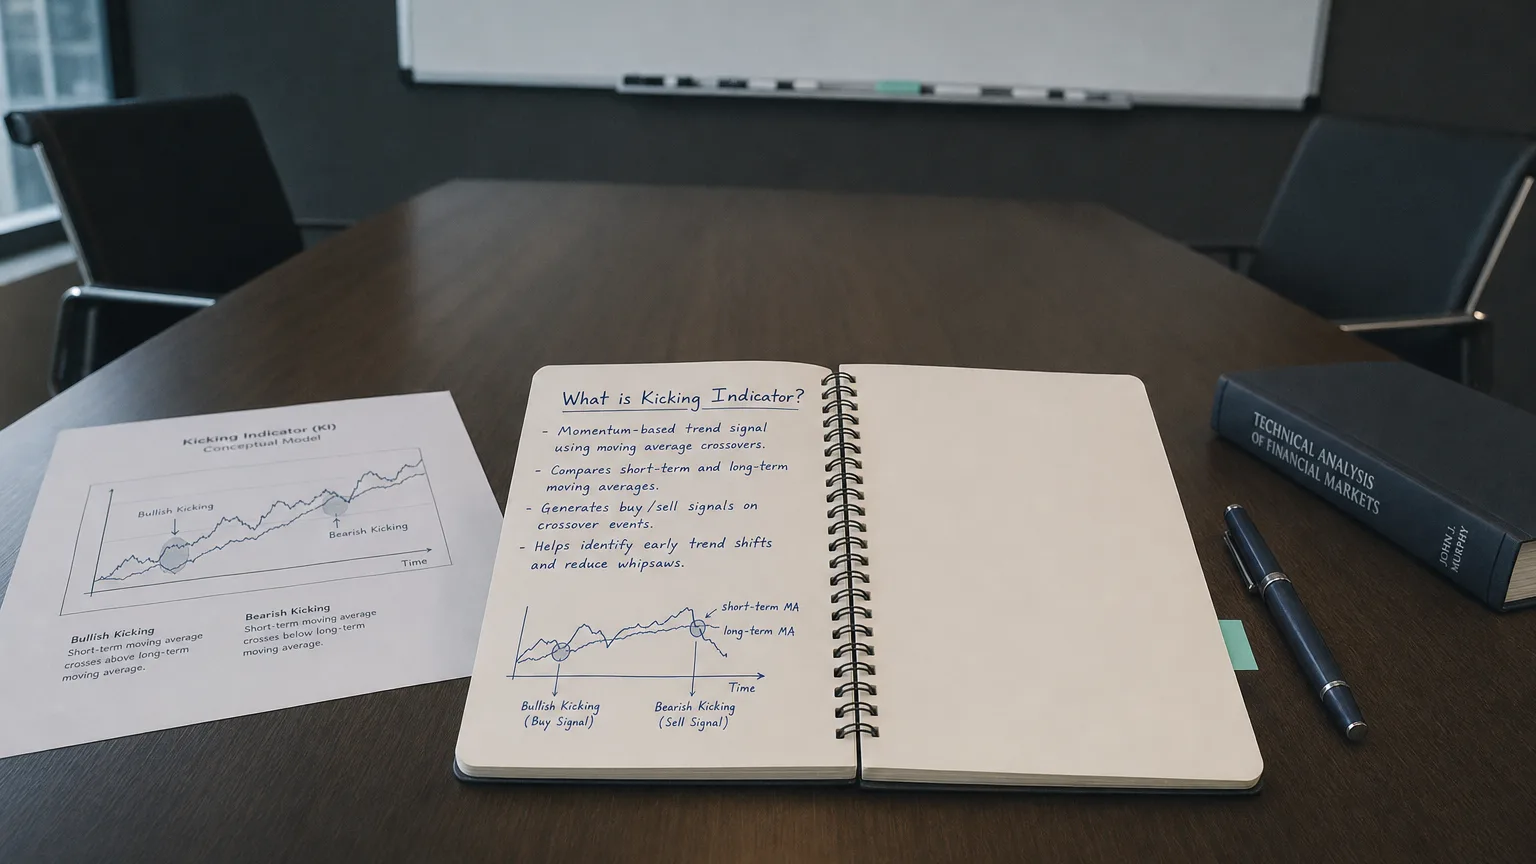
The Kicking (a.k.a. Kicker) pattern is a dramatic two-candle gap formation built from opposing Marubozu candles—bars with virtually no shadows.
-
Bullish Kicking: a long black/red Marubozu is “kicked” upward the next day by a white/green Marubozu that gaps completely above the prior open.
-
Bearish Kicking: a long white/green Marubozu is “kicked” downward by a black/red Marubozu that gaps completely below the prior open.
Because the bodies never overlap, the pattern captures an overnight sentiment shock so strong that it erases all memory of the previous session.
Recognition checklist
| Rule | Bullish Kicking | Bearish Kicking | Why it matters |
|---|---|---|---|
| Candle #1 | Long Black Marubozu | Long White Marubozu | Establishes decisive control by one side |
| Overnight gap | Opens above prior open (no overlap) | Opens below prior open | Signals an abrupt sentiment flip |
| Candle #2 | Long White Marubozu that closes at/near high | Long Black Marubozu that closes at/near low | Reinforces new control; zero shadows preferred |
| Prior trend | Not required (acts as reversal or continuation) | Same | Pattern itself provides the shock factor |
Tip: the larger of the two bodies usually dictates the expected follow-through direction.
Market psychology
-
Day 1 dominance: One side (bulls or bears) finishes with total control (Marubozu).
-
Overnight catalyst: News, earnings, macro data or outsized block order hits the tape.
-
Day 2 revolt: The opposite side gaps price past the prior open and drives it one-way all session, trapping anyone anchored to yesterday’s conviction.
-
Aftermath: Forced covering from the surprised side can add fuel to the new move.
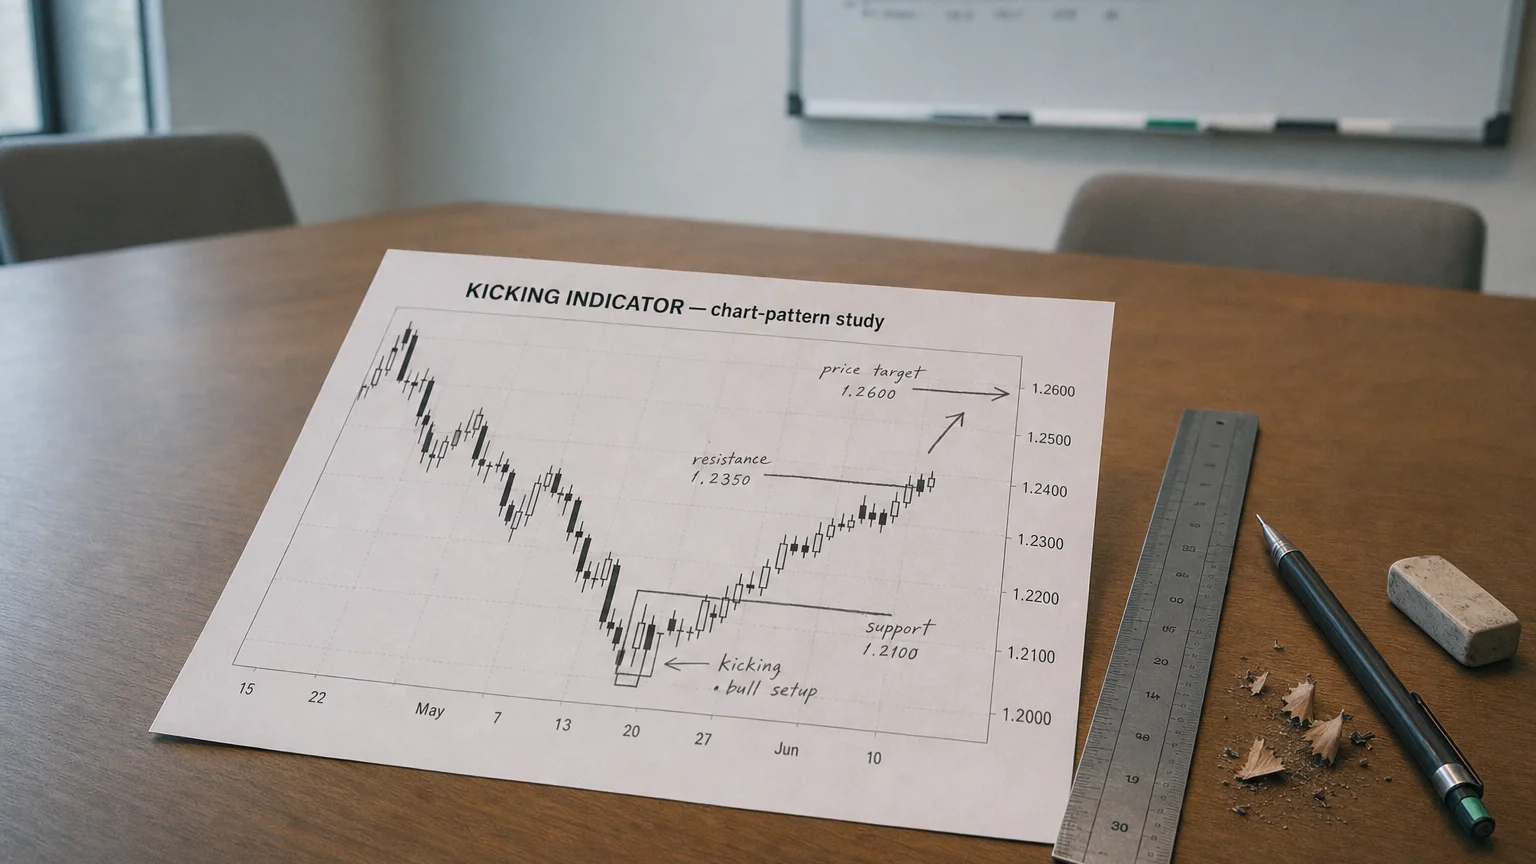
Trading blueprint
| Element | Aggressive tactic | Conservative tactic |
|---|---|---|
| Entry | At/near Candle #2 close | On a break above (bull) or below (bear) Candle #2 high/low next bar |
| Initial stop | Mid-gap or opposite side of Candle #2 body | Beyond Candle #1 extreme or ATR(20)×1 |
| Targets | 1.5–3 R, recent S/R, or measured-move of Candle #2 | Same; trail stop once +1 R |
| Filters that help | Spike in volume, alignment with higher-TF momentum, catalyst awareness | Same plus confirmation close |
If price stalls for 3–5 bars without progress, many traders scale out; the pattern’s edge decays quickly after the initial shock.
Statistical tendencies (Bulkowski, 4.7 M U.S. candles)
| Variant | Reversal success | Frequency rank* | Overall 10-day perf. rank* |
|---|---|---|---|
| Bullish | 53 % (near random) | 100 / 103 | 96 / 103 |
| Bearish | 54 % (near random) | 102 / 103 | 102 / 103 |
*Ranks out of 103 tested candlestick types (1 = common / strong). Bottom line: the Kicking is ultra-rare and, statistically, only slightly better than a coin-flip unless coupled with confirmation and context.
Strengths
-
Visually unmistakable gap + twin Marubozu—easy to code or spot.
-
Huge intraday range gives clear invalidation points → tight risk-to-reward structures.
-
Can flag major news-driven regime shifts where other patterns lag.
Limitations & pitfalls
-
Rarity means back-test sample sizes are small; stats are noisy.
-
Near-random reversal rate—requires secondary confirmation (volume, structure, catalyst).
-
Gaps in thin or limit-up/limit-down markets may exaggerate the pattern without follow-through.
Quick visual cheat-sheet
-
Bullish Kicking
-
Long red marubozu
-
GAP above prior open
-
Long green marubozu
-
-
Bearish Kicking
-
Long green marubozu
-
GAP below prior open
-
Long red marubozu
-
Summary
The Kicking Indicator is the candlestick market’s version of a mic-drop—two brutal, back-to-back Marubozu separated by a full gap that screams “sentiment just flipped on a dime.” Trade it like an opportunist: demand a real gap, insist on momentum or volume confirmation, set surgical stops inside the gap, and ride the post-shock follow-through while it’s hot. Miss the first kick and the edge is gone—so stay nimble and rock that risk management.
Q · 01What is Kicking Indicator?+