Understanding the Long Line Candle
A Clear Signal of Market Momentum and Conviction Understand the definition, calculation, and practical use cases for investors.

Overview
A Clear Signal of Market Momentum and Conviction Understand the definition, calculation, and practical use cases for investors.
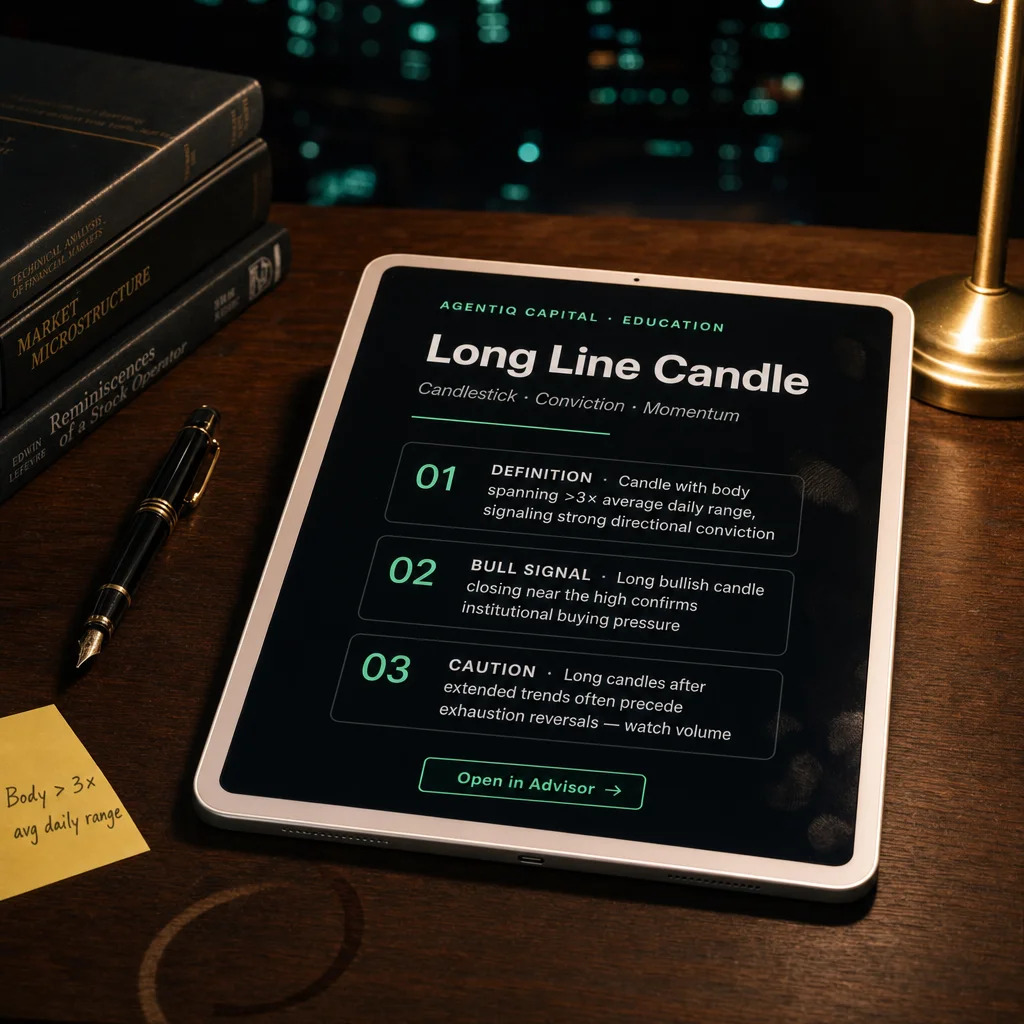
“Long Line” (also called Long Day) is a single-bar momentum candle distinguished by an unusually large real body and minimal shadows. A white/green body (“bullish long line”) signals session-long buying pressure, while a black/red body (“bearish long line”) reflects persistent selling. The term “line” is preferred by some platforms to avoid confusion with the word “day” on intraday charts.
Identification checklist
| Rule | Specification | Why it matters |
|---|---|---|
| Body length | > average true body of the last N candles (typical filters: 1.5–2 × 20-bar average) | Objectively flags unusually strong one-sided action |
| Shadows | Ideally ≤ 25 % of total range on each side | Emphasises dominance—very little intrabar pull-back |
| Colour | White/green = bullish; black/red = bearish | Direction of the intraday trend |
| Trend context | Works as continuation more often than reversal | Reflects that strength usually carries forward |
Market psychology
Wide body: one faction controlled the tape from open to close.
Tiny wicks: attempts to fade the move were absorbed quickly.
After-effect: if follow-through ensues, late traders pile on; if price instantly stalls, trapped traders can spark a sharp snap-back.
Trading approach
| Element | Bullish Long Line | Bearish Long Line |
|---|---|---|
| Entry (pro) | Buy on close or next-bar break above high | Sell/short on close or break below low |
| Entry (conservative) | Wait for confirmation close above high on stronger volume | Wait for confirmation close below low |
| Initial stop | Below candle low or 1× ATR(14) | Above candle high or 1× ATR(14) |
| Targets | 1.5–3 R, prior resistance, measured-move of body | Mirror for shorts |
| Filters that lift edge | Rising volume, alignment with 20-EMA slope, higher-time-frame structure | Same, in reverse |
If price fails to extend ≥ 0.5 R within 3–4 bars, many swing traders trim or scratch—momentum candles lose power quickly when they stall.
Statistical tendencies
| Variant (Bulkowski 4.7 M US candles) | Acts as continuation* | Overall performance rank** | Frequency rank** |
|---|---|---|---|
| Long White Day | 58 % | 53 / 103 | 10 / 103 |
| Long Black Day | 53 % | 19 / 103 | 9 / 103 |
*Breakout direction 10 days after the close.
**1 = best / most common.
Independent testing (AnalyzingAlpha, 600 signals, 1990-2024) shows bullish and bearish long lines each produce ≈ 1.1 profit factor when traded with the prevailing trend and confirmed by a volume spike.
Strengths
Ultra-simple pattern—one candle, easy to code or eyeball.
Clear risk points—stops tuck outside a single bar.
High frequency—appears far more often than exotic multi-bar formations.
Limitations & pitfalls
Modest raw edge—continuation probability only slightly above 50 %.
Mean-reversion danger if the long line forms into major support/resistance or after a news spike that quickly fades.
Time decay—edge erodes fast; demand follow-through within a few bars.
Summary
A Long Line Candle is the chart’s way of shouting “one-sided conviction right now.” Treated as a momentum continuation trigger—paired with volume, trend filters, and swift confirmation—it offers a tight-risk springboard to ride that conviction. Ignore the follow-through, and the same candle can just as easily mark an exhaustion climax. Measure the body, respect the context, manage the stop, and let the market’s longest line draw your profit path.