Linear Regression Angle (LRA) Indicator is a financial concept covered in this article. The Trend Steepness Gauge That Speaks in Degrees
There is nothing new on Wall Street or in stock speculation. What has happened in the past will happen again and again.

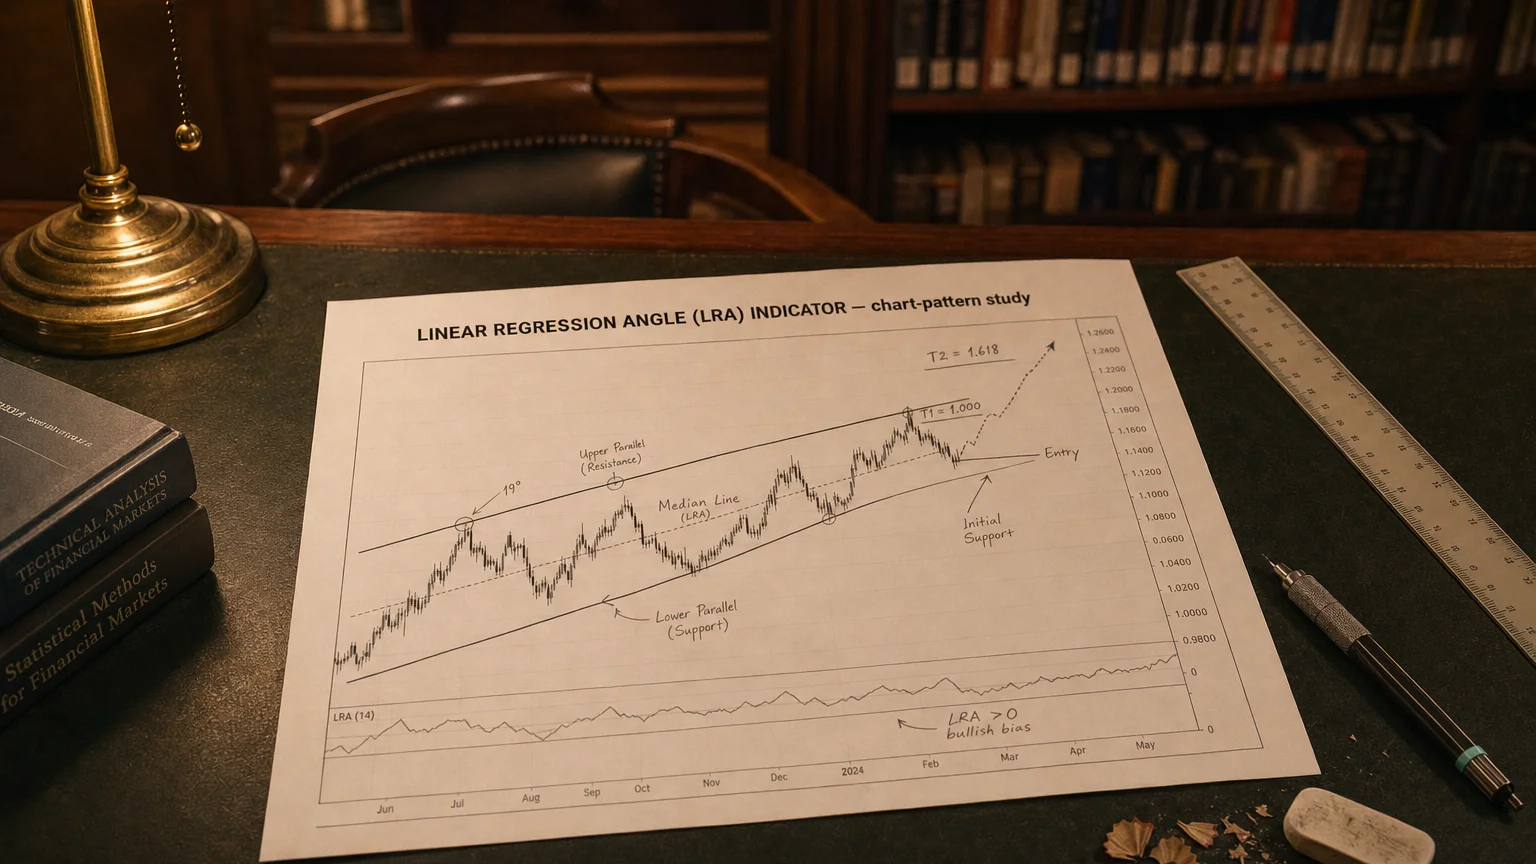
What the LRA Actually Is
The LRA takes the slope of a linear-regression line fitted through the last N price bars and turns that slope into an angle measured in degrees.
-
Positive angle → line tilts upward → bullish momentum.
-
Negative angle → line tilts downward → bearish momentum.
-
Near-zero angle → price is drifting sideways.
Why bother with degrees? They’re intuitive: everyone “feels” the difference between a gentle +8° climb and a +35° rocket.
Core Math in One Breath
-
Number each bar in the look-back window 1…N.
-
Run an ordinary least-squares regression of Price (y) on Bar Index (x).
-
Grab the regression slope m (price change per bar).
-
Convert slope to an angle:
(Formula — visualization pending)
That’s it—no moving-average voodoo, no lagging dividers.
Interpreting the Angle
| Angle Range | Market Pulse | Typical Playbook |
|---|---|---|
| > +25° | Explosive up-trend | Ride the wave long; use trailing stops |
| +10° – +25° | Building strength | Buy breakouts or buy pullbacks into support |
| −10° – +10° | Sideways chop | Mean-reversion, range trades, or stand aside |
| −25° – −10° | Growing weakness | Tighten longs, hunt early short setups |
| < −25° | Hard down-trend | Short the rallies; don’t catch falling knives |
Pro tip: Steeper angles can mean bigger and faster moves—great for profit, brutal for stops.
Parameter Tweaks
| Setting | Effect | When It Rocks |
|---|---|---|
| Short look-back (e.g., 14) | Reacts fast, but whips in noise | Day-trading highly liquid names |
| Long look-back (e.g., 50–60) | Smoother, slower turns | Swing/position ideas, weekly charts |
| Smooth the angle (MA of LRA) | Filters spikes | Crypto, high-volatility equities |
| **Dead-zone filter (ignore | angle | < 5°)** |
Playmates & Confirmations
-
Volume / On-Balance Volume – is angle acceleration backed by participation?
-
Momentum oscillators (RSI, CMO) – watch for divergence against a rising or falling angle.
-
Market structure – pair steep angles with higher-highs or lower-lows for clean signals.
Strengths vs. Landmines
| Strengths | Limitations |
|---|---|
| Simple, intuitive “steepness gauge” | Choice of N radically alters personality |
| Universal across assets & timeframes | Needs enough bars—will lag abrupt reversals |
| Filters random wander better than plain slope | Violent gaps can spike angle, fooling trend traders |
7 | Implementation Checklist
-
Define your anchor timeframe (e.g., 5-min for scalps, daily for swings).
-
Back-test thresholds for each symbol—+22° might scream trend on EURUSD but barely whisper on NVDA.
-
Demand confluence—price action + angle + volume.
-
Scale risk to angle—steeper slopes = bigger ATR = smaller position sizes.
-
Re-tune periodically—volatility regimes change, and your N may need to change with them.
Bottom Line
The Linear Regression Angle distills both direction and velocity of price into one slick, head-banging number. Use it to:
-
Grade the quality of trends,
-
Filter out dull sideways stretches, and
-
Time entries when momentum kicks into high gear.
Keep an eye on context and risk, because even the hottest guitar solo eventually cools off. Rock on and trade smart!
Q · 01What is Linear Regression Angle Lra Indicator?+