is a financial concept covered in this article. The Statistically Perfect 'Fair-Value' Trend Axis
The goal of a successful trader is to make the best trades. Money is secondary.

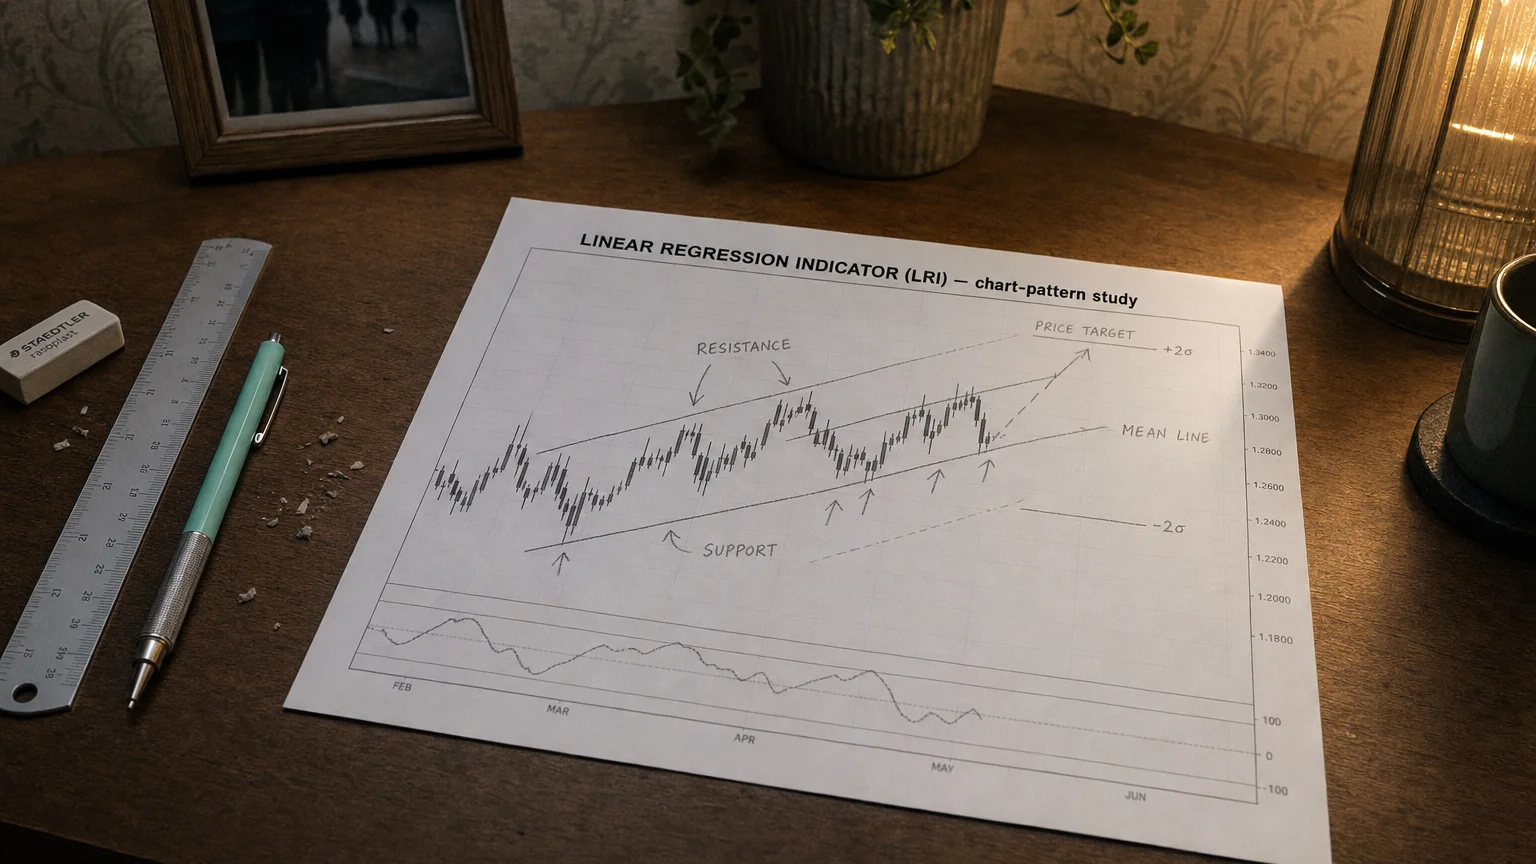
The Linear Regression Indicator (LRI) draws the least-squares best-fit straight line through the last N prices and projects that line through the current bar. It acts as a dynamic “fair-value” trend axis: prices oscillating above it are temporarily strong; prices below are weak. In code you’ll often see its slope, intercept, or a regression channel (± k·σ) built around the core line.
Math on one napkin
For a window of length NNN with time index x=0,1,…,N−1x=0,1,\dots,N-1x=0,1,…,N−1 (0 = oldest) and prices PxP_xPx:
(Formula — visualization pending)
The regression value on the most-recent bar (index x=N−1x=N-1x=N−1) is
Compute standard error
σ= 1N∑(Px−(α+βx))2\sigma = \sqrt{\\tfrac{1}{N}\sum\bigl(P_x-(\alpha+\beta x)\bigr)^2 }σ=N1∑(Px−(α+βx))2
to draw ±1 σ or ±2 σ regression channels.
Reading the line
| Observation | Meaning | Tactical cue |
|---|---|---|
| Slope > 0 and steep | Up-trend intensity | Bias long; channel lower rail = stop |
| Slope < 0 | Down-trend | Bias short; channel upper rail = stop |
| Price pierces +1 σ then snaps back | Over-extension | Fade to mean or trail profit |
| Slope flattens toward 0 | Trend → range transition | Tighten stops; prep mean-revert tools |
Because the line rolls forward each bar, its slope turns within one period of an authentic change in directional bias—far quicker than a long SMA.
Popular trading frameworks
-
Regression Channel Pull-back
Up-trend: Buy on test of lower 1 σ band; stop beneath −2 σ; target upper band or +1.5 R. -
Slope Filter
Only take Moving-Average crossover signals when ∣β∣|\beta|∣β∣ (annualised) > threshold (e.g., 5 %/month). -
Slope Divergence
Price makes higher high while slope falls → possible exhaustion; look for momentum confirmation to short. -
Mean-Reversion Swing
In flat slope (< ε) regimes, sell +1.5 σ spikes, buy −1.5 σ dips.
Strengths
-
Statistically grounded – least-squares fit minimises total squared error.
-
Dual output – gives both level (line) and velocity (slope).
-
Versatile – foundation for channels, standardized (z-score) oscillators, or volatility-adjusted stops.
Limitations & pitfalls
-
Equal weighting – every price in the window counts the same; sudden regime shifts need a shorter N or adaptive length.
-
Lag – the intercept lags ~½ N bars, though slope responds faster.
-
Data freak-outs – single outlier within N bars can tilt the line; consider robust regression or Winsorizing.
-
Window choice sensitive – short windows = whipsaws; long = sluggish.
Take-away
The Linear Regression Indicator draws a continuously updating least-squares price axis:
LRIt=α+β(N−1),β=slope, α=intercept.\text{LRI}_t=\alpha+\beta(N-1),\qquad \beta=\text{slope},\\alpha=\text{intercept}.LRIt=α+β(N−1),β=slope,α=intercept.
Use the line as an adaptive mean, the slope as a real-time trend gauge, and channel bands (± k·σ) as actionable support, resistance, and risk boundaries. Tune N to the timeframe you trade, pair the slope with momentum or volume confirmation, and let this statistically solid tool keep your strategy on the right side of both the road and the rhythm. Rock on and manage that risk!
Q · 01What is Linear Regression Indicator?+