
is a financial concept covered in this article. The Trend's Starting Point – Your Hidden Fair-Value Anchor
The goal of a successful trader is to make the best trades. Money is secondary.

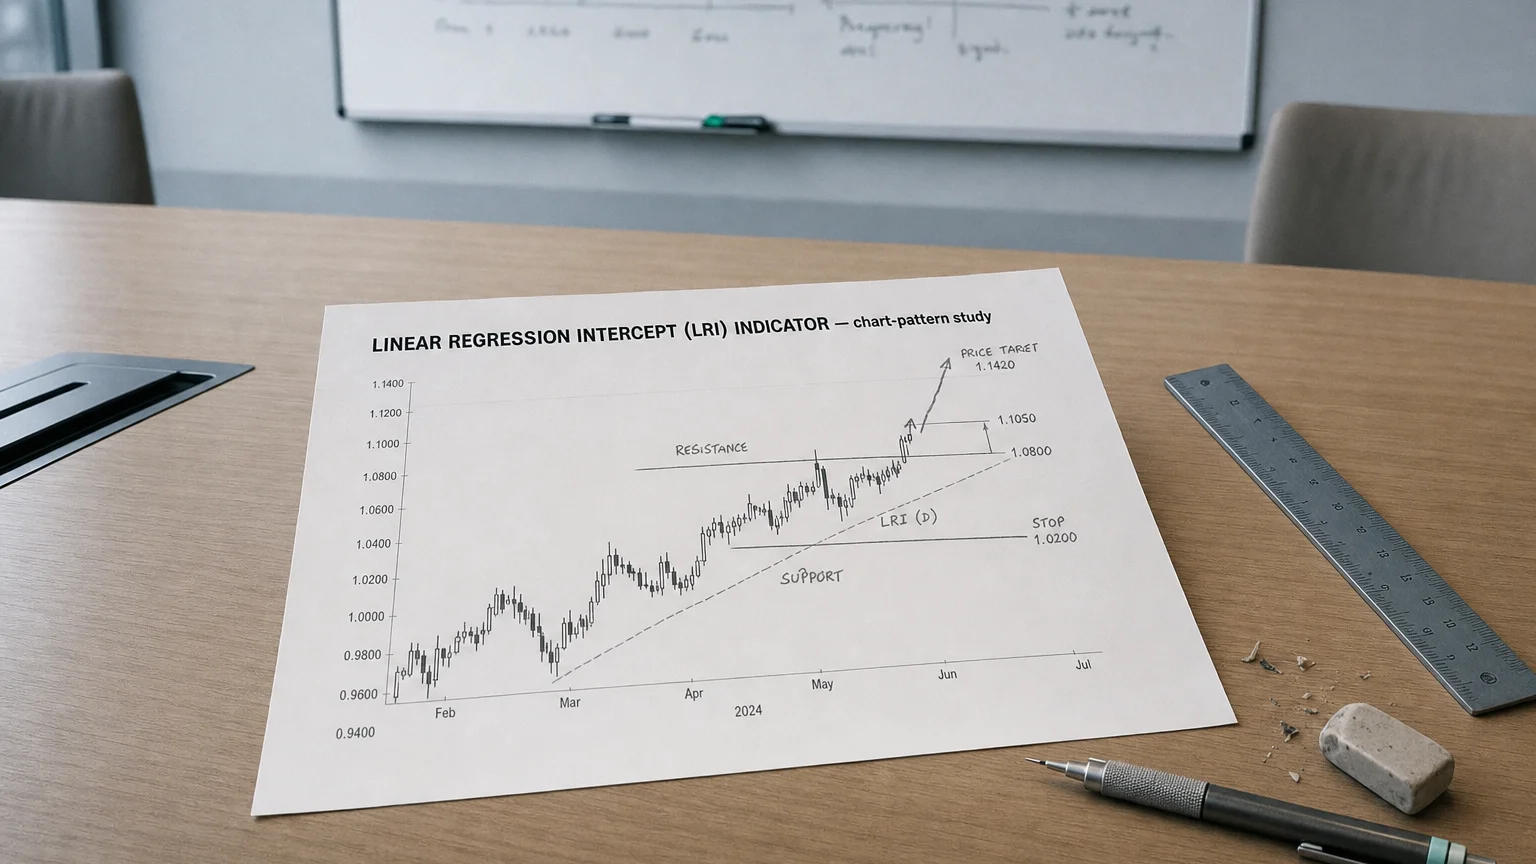
The Linear Regression Intercept (LRI) is the “starting value” of a best-fit line drawn over a selected period (N bars) of price data. Unlike the slope or angle, which measure rate of change, the intercept shows where that trend line would cross the Y-axis — that is, the theoretical price at the start of the regression window.
In simpler terms:
It tells you what the “fair value” was at the beginning of the lookback period, given the current trend.
Core Calculation
The LRI is derived from the linear regression equation:
y=mx+by = mx + by=mx+b
Where:
-
y = price
-
x = bar index (e.g., 0 to N−1)
-
m = slope of the regression line (Linear Regression Slope)
-
b = intercept — this is the Linear Regression Intercept
Once the regression line is computed over the last N bars, the intercept b is extracted directly. This value updates with each new bar, shifting over time like a trailing anchor point.
How to Use the Intercept in Trading
While the slope of a regression line tells you the market’s direction, the intercept gives a reference value for where the trend began.
This can be used to:
| Use Case | Interpretation |
|---|---|
| Trend Confirmation | Rising intercept = upward pressure in base value |
| Mean-Reversion Anchor | Price far above/below intercept may snap back |
| Comparative Trend Mapping | Intercepts across sectors show relative fair value shifts |
Imagine you’re watching multiple stocks in a sector:
-
$AAPL has a high and rising intercept
-
$MSFT has a low and flat intercept
➡ You might deduce AAPL’s base momentum is stronger even if slopes are similar.
Pairing the LRI with Other Indicators
| Combine With | Why It Rocks |
|---|---|
| Slope or Angle | Confirm both the velocity and origin of the trend |
| Bollinger Bands | Check how far price stretches above LRI baseline |
| Volume | Rising intercept on rising volume = serious accumulation |
| RSI / CCI | Mean-reversion signals relative to intercept baseline |
You can also use LRI to build a custom channel:
-
Plot LRI plus/minus a multiple of recent volatility (e.g., ATR)
-
Use these dynamic bands like Bollinger-style guides
Practical Trading Strategies
- 🔹 Strategy 1: LRI Pullback Entry
-
Wait for price to rise with a rising LRI
-
Buy when price temporarily dips near the LRI
-
Stop-loss just below the intercept + volatility filter
- 🔹 Strategy 2: Intercept Slope Divergence
-
If price is flat but LRI is climbing → latent bullish power
-
If price is climbing but LRI is falling → shaky trend, potential reversal
- 🔹 Strategy 3: Sector Strength Heatmap
Use LRI values across multiple tickers:
-
Rank them by intercept levels
-
Overlay momentum to spot stealth leaders
Strengths & Limitations
| Strengths | Limitations |
|---|---|
| Anchors price action with a trend-origin baseline | Not standalone — needs context |
| Can spot hidden strength/weakness via early trend math | Sensitive to look-back period (N) |
| Pairs beautifully with slope, channels, and volatility bands | Doesn’t tell direction without slope |
Bottom Line
The Linear Regression Intercept is the backstage manager of the trend — rarely in the spotlight but crucial to understanding the full stage setup. It tells you where the music started, not just how loud it’s playing now.
Used wisely, it’s your anchor, your mean, and your map of market memory.
So plug in, scan those intercepts, and let your trades riff on the rhythm of true price structure.
Q · 01What is Linear Regression Intercept Lri Indicator?+