On-Neck Candlestick Pattern is a financial concept covered in this article. The Bearish Pause That Presses the Downtrend
There is nothing new on Wall Street or in stock speculation. What has happened in the past will happen again and again.

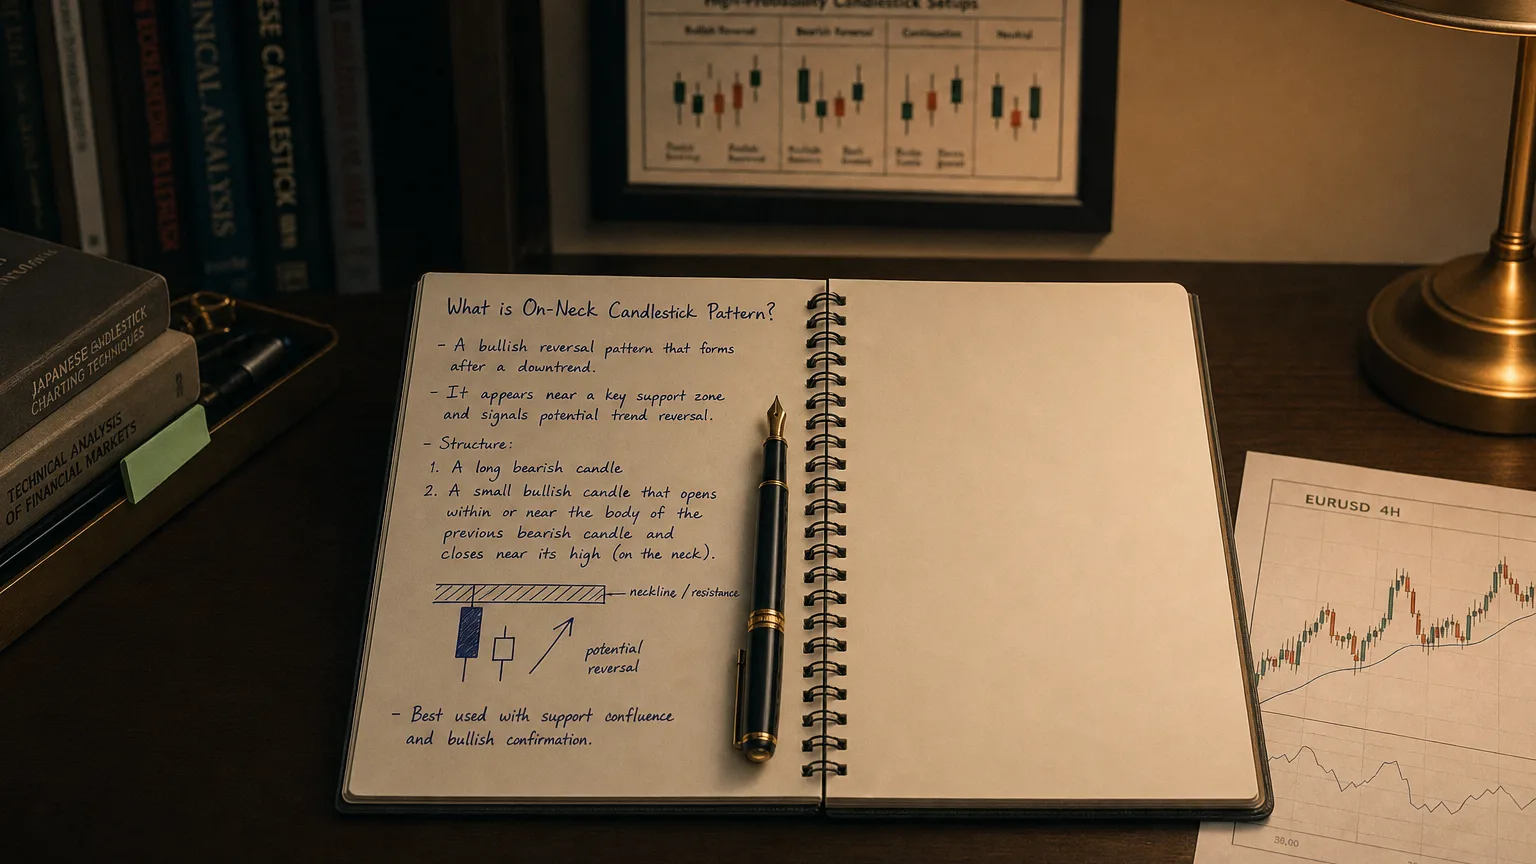
The On-Neck is a two-candle bearish-continuation formation that shows up only in a down-trend. It begins with a long black/red candle that drives price to fresh lows; the next session gaps lower but rallies just enough to close exactly at (or a tick above) the prior candle’s low. That matching “neck-line” hints at temporary support, yet the inability to punch higher tells us sellers still dominate.
Identification checklist
| Rule | Specification | Why it matters |
|---|---|---|
| Trend | Clear, steady decline | Pattern is a continuation cue |
| Candle #1 | Long bearish body closing near low | Bears in full control |
| Gap open | Candle #2 opens below Candle #1’s low | Overnight follow-through by bears |
| Candle #2 close | Closes exactly at (or ≤0.1 % above) Candle #1 low → forms a flat “neck-line” | Bulls manage only a token bounce |
| Shadows | Allowed; Candle #2 body usually short | Visual emphasis on equal closes |
(If Candle #2 closes slightly above Candle #1 close, the pattern is In-Neck; if it closes much higher it becomes Piercing or Bullish Harami.)
Market psychology
-
Bear momentum (C-1): shorts press decisively, longs capitulate.
-
Gap & test (C-2 open): sellers push again but buyers step in around yesterday’s low.
-
Stall, not reversal (C-2 close): bulls can’t lift past the neck-line; bears still dictate tone. The shared close often becomes an “air pocket” that, once broken, accelerates the next leg down.
Trading blueprint
| Element | Typical tactic |
|---|---|
| Entry (short) | Aggressive: sell on C-2 close. Conservative: sell a break below the neck-line on the next bar. |
| Initial stop | Above C-2 high or midpoint of C-1 body. |
| Profit targets | 1.5–3 R, nearest demand zone, or measured-move equal to C-1’s height. |
| Filters that sharpen edge | Rising volume on C-1, 20-EMA sloping down, RSI < 40, macro catalyst with bearish bias. |
| Time stop | If price fails to drop ≥ 0.5 R within 3–4 bars, scale out—the edge decays quickly. |
Intraday quants also short a re-test of the neck-line from below, keeping stops tight just above it.
Statistical tendencies (Bulkowski, 4.7 M daily candles)
| Metric | Result |
|---|---|
| Theoretical bias | Bearish continuation |
| Actual continuation | 56 % (downward) |
| Frequency rank | 70 / 103 (rare) |
| Overall performance rank | 33 / 103 |
| Best 10-day move | 8.3 % in bear markets, up breakout (mean-reversion surprise) |
Bearish continuation edge is modest, so confirmation is crucial.
Strengths
-
Objective two-bar rules – easy to code or spot.
-
Clean risk line: the shared close offers a surgical stop level.
-
Frequently precedes strong pushes when the neck-line finally gives way.
Limitations & pitfalls
-
Rarity – you may wait weeks on liquid symbols.
-
Raw continuation rate only slightly better than a coin-flip; require volume or momentum confirmation.
-
Often confused with In-Neck; mis-labeling degrades stats.
Quick visual cheat-sheet
-
⬇️ Down-trend
-
🟥 Long red candle (C-1)
-
↘ gap-down open
-
🟩/🟥 Small body closes ≈ C-1 low
-
── Neck-line (equal closes)
-
⚠️ Short on break of neck-line | Stop above C-2 high
Summary
The On-Neck Pattern is a bearish “pause-and-press” signal: two candles share a neck-line that momentarily stalls the slide, but history says bears regain the wheel more often than not. Trade in the direction of the underlying down-trend—sell the neck-line breakdown, keep stops just overhead, and look for prompt follow-through. Pair the pattern with volume surge, trend filters, or macro catalysts to turn its modest statistical edge into a sharp, low-risk continuation trigger. Rock the confirmation, guard the risk, and let the neck-line snap propel your P&L.